Age-Graded Running Performance Explained
Age grading turns a race time into a percentage of the standard for that age, sex and distance. A 49:30 ten kilometre is worked through to 70.7% at 58 and 53.3% at 24, with the two divisions behind it and the bands that read the result.
JCVerified Verified by Jobi Cheriyan, Founder & Builder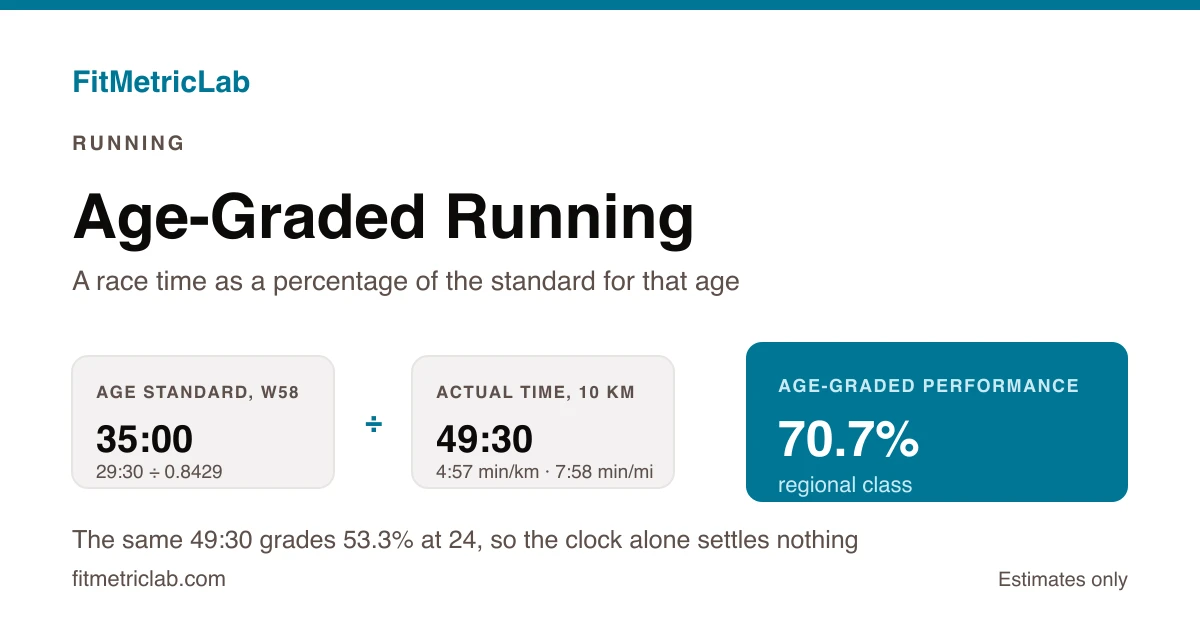
Two runners cross the line together in a 10 km (6.21 mile) road race, both at 49:30. One is 24, the other 58. The clock cannot tell them apart, yet holding 4:57 min/km (7:58 min/mile) at 58 is not the same athletic feat as holding it at 24. Ask what is age grading running performance against, and the answer is a published table of age standards: run both results through it and they come out as 53.3% and 70.7%. The age-graded running performance calculator handles the final division, so either figure can be reproduced rather than taken on trust.
What is age grading in running?
Age grading expresses a race result as a percentage of a reference standard for that distance, that sex and that exact age. That standard comes from a published table, built from the best times recorded at each age, so a 58-year-old is measured against what 58-year-olds have actually run rather than against an open field. What comes out is a single percentage. One hundred per cent means a result level with the standard for that age; everything below it describes how far short of that mark the run fell. Identical percentages describe identical relative quality, whether the run was a 5 km or a marathon.
Why a percentage travels further than a time
Raw times only compare with themselves. A 49:30 ten kilometre is faster than a 52:00, and that is the whole of what it says. It cannot be set against a half marathon, against the same runner a decade earlier, or against a club-mate thirty years older.
Endurance performance declines with age in a pattern that is gradual through the thirties and forties and steeper thereafter, and the decline differs by event and by sex. Age-standard tables absorb that pattern. Once a result is a percentage, a 5 km and a marathon sit on one axis, and so do a 24-year-old and a 58-year-old. That is also why age grading is used to seed masters competitions and to rank mixed-age fields, where comparing clock times would settle nothing.
How the age-graded percentage is calculated
Two steps. First the open standard for the event is divided by the age factor for that age and sex, which gives the age standard: the time an athlete of that age would run to be level with the open mark. Then the age standard is divided by the actual time and multiplied by one hundred.
age standard   =  open standard  /  age factor

age-graded %   =  (age standard  /  actual time)  x  100
The variables, with units:
- open standard (minutes) — the reference time for the event, taken from the age-standard table
- age factor (dimensionless, between 0 and 1) — the table entry for that exact age and sex; 1.0000 at the peak ages, falling with age
- age standard (minutes) — the open standard adjusted to that age
- actual time (minutes) — the race result, in decimal minutes rather than minutes and seconds
- age-graded % (per cent) — the output
An equivalent route multiplies the actual time by the age factor to get an age-graded time, then divides the open standard by that. Both orders return the same percentage, and the worked example below shows them agreeing.
A worked example
Take the 58-year-old from the opening. She runs 10 km (6.21 miles) in 49:30, which is 49.5 minutes in decimal form, a pace of 4:57 min/km (7:58 min/mile).
The open standard for the women's 10 km in this illustration is 29:30, or 29.5 minutes, and the table factor at 58 is 0.8429. Dividing gives the age standard:
29.5 / 0.8429 = 34.998 minutes = 35:00So a 58-year-old woman running 35:00 would be level with the open standard. Now the result itself:
(34.998 / 49.5) x 100 = 70.7035 = 70.7%Checking by the other route, the age-graded time is 49.5 x 0.8429 = 41.72 minutes, or 41:43, and 29.5 divided by 41.72 is 70.7035 again. Only the final figure is rounded, to 70.7%.
The 24-year-old man finishing alongside her is at his peak ages, so his factor is 1.0000 and his age standard is the open men's mark of 26:24, or 26.4 minutes. His percentage is (26.4 / 49.5) x 100, which returns 53.3%. One clock time, seventeen percentage points apart.
How to use the Age-Graded Running Performance Calculator
The age-graded performance calculator for runners performs the second step, the division that turns two times into a percentage. It takes two fields:
- Actual Time (minutes) — the race result in decimal minutes, so 49:30 is entered as 49.5
- Reference Time (minutes) — the age standard for that age, sex and distance, also in decimal minutes
The age factor itself is not built in, which is deliberate: the tables are revised periodically, and hard-coding a snapshot would quietly go stale. Instead, the reference time is read from the current published table and typed in, so the figure on screen always reflects the table in force rather than whatever was current when the page was written.
What appears is the percentage to one decimal place, with a band attached: 90% and above is labelled world class, 80% national class, 70% regional class, 60% local class, and anything below that recreational. Those bands are a reading aid, not a ranking anyone is entered into.
Common scenarios
Comparing two distances in one season
A runner posts a 5 km and a marathon four months apart and wants to know which was the better run. Clock times cannot answer that. Graded against their own age standards, the two results become percentages on one scale, and the gap between them points at which distance the current training suits. Pairing that with a vdot calculator (jack daniels) gives a second, physiology-based reading of the same pair of races.
A masters runner watching a moving target
Past the mid-forties, a runner holding the same clock time year after year is improving in age-graded terms, because the standard is moving towards them. A flat line of race times and a rising line of percentages describe the same two seasons, and the percentages carry the information the times discard.
Mixed-age club competitions
Clubs across the UK, Ireland, Australia, New Zealand, Canada, the United States and South Africa run internal championships on age-graded percentages so that a veteran and a junior can contest the same table. Without a percentage, no single standings list would be possible.
Setting a target before race day
Working backwards from a percentage gives a target time: pick the figure, multiply through, and the age standard divided by it is the time required. A running pace calculator turns that into min/km or min/mile for race day, and a race time predictor (riegel formula) gives a second opinion on whether a recent result supports it.
Common mistakes and misconceptions
- Entering 49.30 for 49:30. Both fields are decimal minutes. Thirty seconds is 0.5 of a minute, not 0.30, and the slip reads as an eighteen-second error that quietly shifts the percentage.
- Mixing standards across sexes or distances. An age factor is specific to one sex and one event. A women's 10 km factor applied to a men's half marathon returns a number, and the number is meaningless.
- Treating the percentage as precise. Built from recorded bests and revised whenever those change, the tables support a figure accurate to roughly the nearest whole percentage point. Two runs half a point apart are not meaningfully different.
- Reading it as a fitness or health score. Age grading describes one race on one day. It says nothing about body composition, cardiovascular health or how well training is going.
- Confusing it with age-group placing. Finishing first in a category is a result against whoever turned up. A percentage is a result against a fixed standard, and the two regularly disagree.
Frequently asked questions
What is a good age-graded percentage?
The published bands put 60% at local class, 70% at regional, 80% at national and 90% and above at world class, with everything below 60% described as recreational. Those labels are descriptive rather than official entry criteria, and most runners in a typical road race field sit somewhere between 45% and 65%. The figure that carries the most information is a runner's own, tracked across several races, because a percentage climbing over a season says something a single reading cannot. Comparing against other people is what the scale was designed to permit, but it is also the least useful thing to do with it.
Does age grading apply before the masters ages?
Yes, though the adjustment is small or absent. The factor sits at or very near 1.0000 through the peak ages, roughly the twenties and early thirties depending on event and sex, so a result in that range is graded against close to the open standard. Younger athletes are covered too, with the factor falling away again. The method is continuous across the whole age range rather than something that switches on at 35 or 40, which is why a 24-year-old and a 58-year-old can be placed on the same scale at all.
Why did my percentage change when the tables were updated?
Age-standard tables are periodically revised as new performances are recorded, and a revision moves the standard rather than the run. A result from several years ago can therefore grade slightly differently today without anybody having run anything new. Shifts are usually a fraction of a percentage point. It is worth noting which edition of the tables a figure came from when comparing results across a long stretch of time, in the same way a personal best is recorded with the course it was set on.
Can age grading compare running with cycling or swimming?
Not directly. The percentage is calculated inside one sport, against standards built from that sport's recorded times, so a 70% run and a 70% swim describe comparable standing within running and within swimming but do not translate into each other. Several sports maintain their own age-graded or age-adjusted systems, and masters swimming, masters cycling and masters athletics each publish tables of their own. Same shape of arithmetic in every case; the standards behind it are not interchangeable. A genuine cross-sport comparison would need one reference scale covering all of them, and no such scale exists, so the honest reading is that the two figures sit side by side rather than in order.
Is a higher percentage always a better race?
It is a better result against the standard, which is not quite the same question. Conditions, course profile, altitude and weather all move clock times, and the standard takes none of them into account. A hilly race on a windy day can produce a lower percentage than a flat one a fortnight later from identical fitness, with nothing having changed in between. What a percentage describes is the clock time, graded for age and sex, and nothing else about the day. Comparing figures from similar courses in similar weather keeps that noise down, and comparing a single pair of races will always say less than a run of them.
Sources and methodology
Age factors and open standards referenced here come from the age-graded tables maintained by World Masters Athletics, revised periodically as recorded performances change. Specific factors used in the worked example are illustrative figures chosen to show the arithmetic; current values are taken from the table in force. The physiological pattern the tables encode — gradual decline through the thirties and forties, steeper thereafter — is documented in the endurance-ageing literature.
- World Masters Athletics, the governing body that maintains and periodically revises the age-graded tables the method depends on.
- Tanaka H, Seals DR (2008). Endurance exercise performance in Masters athletes: age-associated changes and underlying physiological mechanisms. Journal of Physiology 586(1):55-63, for the shape of the decline the age factors encode.
- Lepers R, Stapley PJ (2016). Master Athletes Are Extending the Limits of Human Endurance. Frontiers in Physiology 7:613, on why the standards themselves move over time.
Putting it together
Age grading converts a race time into a percentage of the standard for that age, sex and distance, which is what lets a 5 km sit beside a marathon and a 24-year-old beside a 58-year-old. The arithmetic is two divisions: the open standard over the age factor gives the age standard, and the age standard over the actual time gives the percentage. In the worked example a 49:30 ten kilometre graded at 70.7% for the older runner and 53.3% for the younger, from one clock time. Run with the current table rather than a remembered factor, and the age grading calculator for race times returns the figure to one decimal place.
Last updated 29 October 2026.