How to measure body fat percentage: Navy method, calipers and more
Body fat percentage separates fat mass from everything else. This guide explains the Navy circumference equations in both metric and imperial, works a full example step by step, and sets out where the estimate drifts.
JCVerified Verified by Jobi Cheriyan, Founder & Builder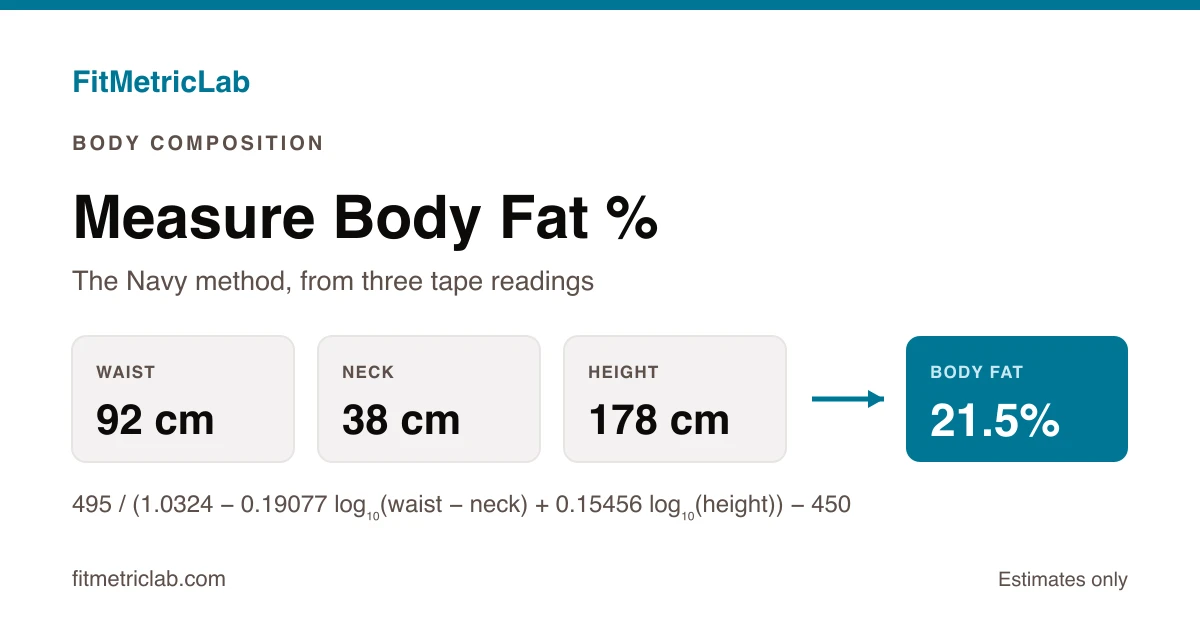
Two people can walk into a gym at the same height and the same 82 kg (180.8 lb) and look nothing alike. One carries visible abdominal fat and modest shoulders. The other is lean and heavily muscled. The scale reports one number for both, and that number hides the thing they actually differ on.
Body fat percentage is the metric that separates them. It splits total body mass into fat tissue and everything else. Anyone wondering how to measure body fat percentage without a clinic can do it with the Navy method body fat percentage calculator, which needs three tape readings and a height. No lab, no scan.
This guide covers what the metric represents, how the circumference equations arrive at a figure, a worked example carried through step by step in both metric and imperial, and the places where the estimate drifts away from reality. Every number here comes from a population-level formula, not a direct reading of tissue.
What body fat percentage measures
Body fat percentage is the share of total body mass made up of fat tissue, expressed out of 100. Someone of 82 kg (180.8 lb) at 20% carries 16.4 kg (36.2 lb) of fat mass. The remaining 65.6 kg (144.6 lb) is muscle, bone, connective tissue, organs and the water held inside them. That second figure has a name: fat-free mass, sometimes called lean body mass.
The metric describes composition rather than size. That is the whole point of it, and it explains how two people of identical height and mass can sit twenty points apart.
Here is the catch: no field method reads composition directly. Tape measures, calipers, impedance scales and even the laboratory references all model composition from something observable, then convert. The circumference equations belong to the tape family. Girths and height go in, an estimate comes out.
Why body fat percentage matters
Body mass on its own conflates two quantities that move independently of each other. Someone can hold a flat number on the scale for a year while adding three kilograms (6.6 lb) of muscle and losing three kilograms of fat. Composition tracking makes that exchange visible. The scale hides it completely.
The figure also feeds other calculations. Fat-free mass, fat-free mass index and protein intake models all take body fat percentage as an input, which means an error at this stage propagates into everything built on top of it.
Population reference ranges exist, but they vary by the assessment method used to build them, and by sex and age. A figure produced by one method belongs inside the reference range built from that same method. Comparing a tape reading against a range derived from DEXA scans introduces an error margin of several percentage points before anything else has gone wrong.
How to measure body fat percentage with the Navy method
The circumference method needs three tape readings for men and four for women. Those feed into a logarithmic equation that predicts body density, and the Siri equation then converts density into a fat percentage. The coefficients come from fitting the model against hydrostatic weighing in a large adult military sample, where it correlated at roughly r = 0.90.
Readings are taken with a flexible tape held snug against the skin without compressing it, at the end of a normal exhale. Men record height, neck circumference just below the larynx, and waist circumference measured horizontally at navel level. Women add a hip reading at the widest point, and take the waist at its narrowest rather than at the navel.
One detail trips up most people who try this from a half-remembered formula: the metric and imperial versions are different equations with different constants. They are not conversions of one another. Both forms are given below.
METRIC (centimetres)

Men:
BF% = 495 / (1.0324 - 0.19077 x log10(waist - neck)
      + 0.15456 x log10(height)) - 450

Women:
BF% = 495 / (1.29579 - 0.35004 x log10(waist + hip - neck)
      + 0.22100 x log10(height)) - 450


IMPERIAL (inches)

Men:
BF% = 86.010 x log10(waist - neck)
      - 70.041 x log10(height) + 36.76

Women:
BF% = 163.205 x log10(waist + hip - neck)
      - 97.684 x log10(height) - 78.387
Where:
- waist = abdominal circumference at navel level in the male equation, and waist circumference at its narrowest in the female one
- hip = hip circumference at the widest point, female equation only
- neck = neck circumference below the larynx
- height = standing height
- log10 = logarithm to base 10
- BF% = estimated body fat as a percentage of total mass
All lengths in a single equation use the same unit. Centimetres throughout for the metric form, inches throughout for the imperial form. The two forms agree closely but not exactly, since each was fitted independently.
A worked example
An adult male stands 178 cm (70.1 in) and weighs 82 kg (180.8 lb). His neck measures 38 cm (15.0 in) and his waist 92 cm (36.2 in). Running the metric equation:
Step one, subtract neck from waist: 92 - 38 = 54 cm.
Step two, take the two logarithms: log10(54) = 1.73239 and log10(178) = 2.25042.
Step three, scale each by its coefficient: 0.19077 x 1.73239 = 0.33049, and 0.15456 x 2.25042 = 0.34782.
Step four, assemble the denominator: 1.0324 - 0.33049 + 0.34782 = 1.04974.
Step five, divide and subtract: 495 / 1.04974 = 471.5471, then 471.5471 - 450 = 21.5%.
Applied to his mass, that splits 82 kg (180.8 lb) into 17.7 kg (39.0 lb) of fat mass and 64.3 kg (141.8 lb) of fat-free mass. That remainder is what a lean body mass calculator returns from body mass and body fat percentage. Rounding happens once, at the end.
Feeding the same body into the imperial equation as a cross-check gives 21.7%, a fifth of a point apart. That gap is the two fitting exercises disagreeing slightly, and it is invisible next to the method's real error margin.
The sensitivity of the result is the interesting part. Hold the worked example steady and move one tape reading at a time, and the estimate shifts by more than most people expect.
| Reading | Estimate | Shift |
|---|---|---|
| Baseline | 21.5% | — |
| Waist 2 cm (0.8 in) too high | 22.9% | +1.4 |
| Waist 2 cm (0.8 in) too low | 20.1% | −1.4 |
| Neck 1 cm (0.4 in) too short | 22.2% | +0.7 |
| Neck 1 cm (0.4 in) too long | 20.8% | −0.7 |
| Height out by 2 cm (0.8 in) | 21.9% | +0.3 |
A 2 cm slip on the waist moves the answer by 1.4 points, which is larger than the composition change most four-week training blocks actually produce. Tape placement, not arithmetic, is where the variation enters.
Using the Navy method calculator
The body fat percentage calculator using the Navy method takes sex, height, neck and waist, plus a hip reading for the female equation. The male form measures the waist horizontally at navel level; the female form takes it at its narrowest. For anyone who wants to measure body fat with a tape measure and nothing else, that is the whole workflow. A metric/imperial toggle sits above the inputs, so readings can be entered in inches and the tool converts them to centimetres before applying the metric equation.
The output is a single percentage and nothing else, since the equation never sees body mass. Turning it into kilograms or pounds of fat and fat-free mass is a second step, and that is what the lean body mass calculator is for. Reading the percentage well means treating it as the centre of a band rather than a point. A returned 21.5% describes someone who is plausibly anywhere between roughly 18% and 25%.
Where the number earns its keep is in how it moves across a series of readings taken under matched conditions. One reading is a rough placement. Six readings over six months are a trend line, and a trend line is worth considerably more.
Which equation is running? The two published forms were fitted separately, so a value entered in inches and run through the imperial equation will not land in exactly the same place as the same body converted to centimetres and run through the metric one. The gap is around a fifth of a percentage point for the worked example here: real, but an order of magnitude smaller than the method's own error band, and not worth losing sleep over.
Common scenarios
An endurance runner across a training block
A runner of 170 cm (66.9 in) and 62 kg (136.7 lb) sees a flat scale through a twelve-week block. Tape readings taken every four weeks show waist girth falling from 80 cm (31.5 in) to 78 cm (30.7 in) with neck unchanged at 35 cm (13.8 in). The equation converts that into a drop from 16.2% to 14.6%, about 1.6 points. The composition moved even though body mass did not.
A lifter tracking fat-free mass
An 88 kg (194.0 lb) lifter at 1.80 m (5 ft 11 in) returning 14% carries 75.7 kg (166.8 lb) of fat-free mass. Divided by height squared, that gives a fat-free mass index of 23.4 through an FFMI calculator, an index that normalises lean tissue against height so that tall and short lifters can be compared on the same scale.
A female reading using the four-site equation
An adult female stands 165 cm (65.0 in) and weighs 62 kg (136.7 lb). Her neck is 32 cm (12.6 in), waist 74 cm (29.1 in) and hip 98 cm (38.6 in). Those three combine into a predictor of 140 cm, and the equation returns 28.4%. The hip term is what distinguishes this form from the male one, and dropping it changes the answer entirely.
Cross-checking against calipers
Someone whose tape reading and caliper reading disagree by four points has not necessarily made a mistake. Skinfold protocols such as the 3-site caliper body fat calculator and the 7-site caliper body fat calculator sample subcutaneous tissue at fixed anatomical sites and were fitted on different populations. Systematic offsets between methods are the expected outcome, not the exception.
Common mistakes and misconceptions
- Treating the estimate as a measurement. The equations carry a standard error of roughly 3 to 4 percentage points. Quoting the output to one decimal place implies a precision the method has never had.
- Mixing unit systems. Height in centimetres with a waist in inches produces a plausible-looking number that means nothing, because the logarithmic terms assume one system throughout.
- Changing tape technique between readings. Tension, landmark and breathing phase each shift the result by a point or more, which is larger than the composition change most four-week intervals actually produce.
- Confusing the metric with body mass index. BMI divides mass by height squared and knows nothing about tissue type. Two people at the same BMI can sit ten or more points apart on body fat.
- Applying the equations outside the population they were fitted on. The samples were adults. The formulas were never validated for children, adolescents or pregnancy, and results in those groups carry no meaning.
Frequently asked questions
How accurate is the Navy body fat method?
How accurate is the Navy body fat method? The answer depends on what it is being compared against. Validation against hydrostatic weighing put the correlation at roughly r = 0.90, with a standard error of about 3 to 4 percentage points for most adults. A Navy method body fat percentage of 21.5% therefore describes an individual who plausibly sits somewhere between 18% and 25%. The estimate tightens for people whose build resembles the population the equations were fitted on, and loosens at the extremes of leanness, of body mass, and of unusual fat distribution. Consistency is the method's real strength: a series of readings taken the same way tracks direction reliably even when the absolute figure carries a wide margin.
Can body fat percentage be measured at home without calipers?
The circumference approach was designed for exactly that situation, which is why most people asking how to measure body fat percentage end up reaching for a tape. It needs a flexible tape, a height measurement, and a mirror or a second person for the neck reading. It sidesteps the skill barrier that makes caliper readings vary so much between operators. Calipers sample subcutaneous fat at fixed sites and can be more precise once technique settles, which is why the 3-site and 7-site protocols exist alongside the tape method. Bioelectrical impedance scales offer a third route, though their readings shift with hydration, food intake and time of day. For most people the practical answer is to measure body fat with a tape measure and keep the technique identical each time.
Why does the formula for women include a hip measurement?
The equations were fitted separately by sex because fat distribution patterns differ at a population level. In the male equation, waist girth minus neck girth carries nearly all the predictive weight. The female equation combines waist, hip and neck instead, since gluteofemoral fat storage contributes a larger share of total fat mass and a waist reading alone leaves that share unaccounted for. The coefficients differ too, so the two equations are not interchangeable and swapping one for the other produces a figure with no validity at all.
How often does it make sense to remeasure?
Body composition moves slowly relative to the error margin of any field method, so readings spaced a few days apart tend to produce noise rather than signal. Intervals of four to six weeks give a change large enough to clear the measurement error. Consistency of conditions matters more than frequency: the same tape, the same anatomical landmarks, the same time of day, a similar hydration state. A single outlying reading in an otherwise steady series usually reflects measurement variation rather than a real shift in tissue.
Sources and methodology
The equations above come from the circumference validation work carried out at the Naval Health Research Center by Hodgdon and Beckett, published as two separate 1984 technical reports, one fitted on men and one on women. Both regressed girth-based predictors against hydrostatic weighing and reported the resulting standard errors.
- Hodgdon, J. A. and Beckett, M. B. (1984). Prediction of percent body fat for U.S. Navy men from body circumferences and height. Naval Health Research Center, Report No. 84-11.
- Hodgdon, J. A. and Beckett, M. B. (1984). Prediction of percent body fat for U.S. Navy women from body circumferences and height. Naval Health Research Center, Report No. 84-29.
- American College of Sports Medicine. ACSM's Guidelines for Exercise Testing and Prescription, body composition assessment chapter, covering field method error margins and protocol standardisation.
The worked example, the sensitivity table and the scenario figures were computed directly from the published equations, with the metric arithmetic reproduced step by step above.
Putting it together
The circumference approach trades a little accuracy for a great deal of access. Three tape readings and a height land within a few points of a laboratory reference for most adults, using equipment that costs almost nothing.
Its weakness follows directly from its inputs. The equations see girths, so anything that moves a girth without moving fat tissue moves the estimate too. A heavy meal, a bloated morning, a shift in posture at the moment of measurement.
Used as a series rather than a single verdict, with matched technique each time, the Navy body fat percentage estimator tracks direction well. The figure it returns opens the interpretation. It does not close it.
Last updated 27 July 2026.