Riegel formula race prediction: how the 1.06 exponent works
The Riegel formula scales a known race time to any other distance using one fitted exponent of 1.06. Here is where that number came from, how to work the arithmetic by hand, and the distances at which the estimate starts to drift.
JCVerified Verified by Jobi Cheriyan, Founder & Builder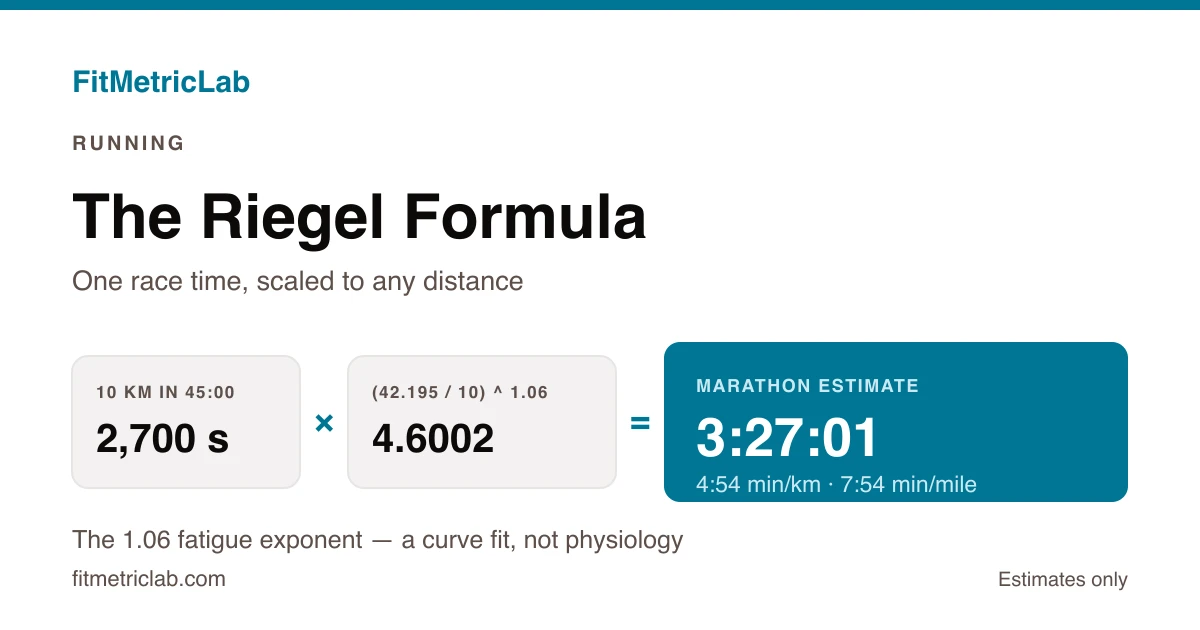
A 45:00 10 km (6.2 mi) is a respectable Saturday morning. What it is worth over a marathon is a different question, and Riegel formula race prediction answers it in one line of arithmetic: 3:27:01. No laboratory, no ramp test, no chest strap. The race time predictor (Riegel formula) runs that same equation, and this article takes it apart.
What follows covers where the formula came from, what the 1.06 exponent is actually doing, how to work the sum by hand, and the point at which the answer starts drifting away from what happens on race day. One thing is worth fixing at the outset. The equation describes how race times have scaled with distance across large groups of runners. It says nothing about what any single runner produces on a given morning.
What Riegel formula race prediction describes
Riegel formula race prediction is a power law linking race time to race distance. Take a time from one distance, divide the new distance by the old, raise that ratio to a fixed power of 1.06, and multiply. The exponent carries one plain observation: as races get longer, average speed falls away in a fairly regular fashion, and it does so at a similar rate across runners whose absolute speeds are nothing alike.
Peter Riegel, a research engineer at the Battelle Memorial Institute who spent decades on road race course measurement and travelled to validate the London Marathon course every year from 1985 to 2010, fitted the relationship to world record performances and set it out in American Scientist in 1981. He named the exponent a fatigue factor. That label does a lot of work for something that is, underneath, a curve fit. There is no physiology inside it. No fuel, no muscle damage, no oxygen uptake. It is a straight line drawn through a scatter of results, and its usefulness comes entirely from how well that line happens to sit.
Why race time prediction is useful
On its own, a race result says one thing about one distance on one day. Turning that single point into a curve is what makes results at different distances comparable at all, and three practical uses follow from it.
The first is equivalence. Put a 10 km time and a half marathon time on the same scale and they can be ranked against each other. Every performance table in the sport rests on some version of that step.
The second is pacing. A projected finish time implies a projected average pace, which turns a vague intention into a number a runner can hold a race plan against, or argue with.
The third is tracking change across training cycles. This season's 5 km and last season's half marathon say little sitting side by side in raw form. Convert both to a common distance and the direction of travel becomes visible.
There is a fourth virtue, and it has nothing to do with running. The formula is open. Every step can be checked by hand, and its single assumption sits in plain sight as the exponent. Predictors built on proprietary lookup tables are far harder to interrogate when the number they hand back looks wrong. Knowing which assumption produced an estimate is what lets anyone judge how much weight it deserves.
None of this ages. The relationship Riegel described is a property of how human endurance scales, not of a season, a shoe or a training fashion, which is why the same equation still sits inside watch software and coaching spreadsheets more than four decades after it was fitted.
How the calculation works
The formula scales one known result by the ratio of the two distances. Because the distances appear only as a ratio, the unit cancels: kilometres and miles both work, provided the same one is used on both sides. Time behaves the same way, though seconds are the least painful unit to handle by hand.
T2 = T1 × (D2 / D1)^1.06Where:
- T1 = the known race time, in seconds (any consistent time unit works)
- D1 = the distance of that known race, in kilometres or miles
- D2 = the target distance, in the same unit as D1
- 1.06 = the fatigue exponent, a dimensionless constant
- T2 = the estimated time at the target distance, in the same unit as T1
All the behaviour lives in that 1.06 fatigue exponent. Set it to 1.0 and average speed never changes, so doubling the distance would exactly double the time. At 1.06, doubling the distance multiplies time by 2 raised to the power 1.06, which comes to 2.0849. That is roughly 4.2 per cent more than a straight doubling, and it is the toll the model charges every time the distance doubles again.
Plot record times against distances on logarithmic axes and they fall close to a straight line. The exponent is the gradient of that line. Riegel's finding was that the gradient stayed similar across athletes whose absolute speeds differed enormously, so fast and slow runners sat on roughly parallel lines rather than lines of a different shape. That parallelism is the entire justification for applying one exponent across a whole population.
He fitted the value to world records spanning efforts of roughly 3.5 to 230 minutes, and he never treated it as a single universal number. Swimming and cycling each drew their own fatigue factor, as did different age and sex groups within running. Riegel put the running exponent at around 1.08 for elite athletes and 1.05 to 1.06 for male recreational runners aged 40 to 70. The 1.06 that turns up in almost every race calculator is the general running value from his first published version of the formula, which appeared in Runner's World in August 1977 under the title "Time Predicting". The 1981 paper widened it to other sports and broke the exponent out by group.
One oddity is worth sitting with. Riegel's recreational figure falls below his elite one, which is the reverse of what later marathon data suggests, and nobody has tidily resolved that. The likeliest reading is that his recreational sample was drawn from committed club runners at distances well short of the marathon, where the slowdown really is gentler. Stretch the same exponent across the marathon and the picture flips.
A worked example
Take that runner with a recent 10 km (6.2 mi) of 45:00, an average of 4:30 min/km (7:15 min/mile). The question is what the same fitness implies over a marathon, 42.195 km (26.2 mi).
Step 1. Convert the known time to seconds. 45 minutes is 45 × 60 = 2,700 seconds.
Step 2. Form the distance ratio. 42.195 / 10 = 4.2195. The marathon is a little over four times the known distance.
Step 3. Raise the ratio to the exponent. 4.2195 to the power 1.06 = 4.600199, noticeably larger than the ratio itself. The gap between 4.2195 and 4.6002 is the fatigue penalty, written as a number.
Step 4. Multiply. 2,700 × 4.600199 = 12,420.54 seconds.
Step 5. Convert back. 12,420.54 seconds rounds to 3 hours, 27 minutes and 1 second, so 3:27:01. That works out at 4:54 min/km (7:54 min/mile).
The same runner over a half marathon, 21.0975 km (13.1 mi), gives a ratio of 2.10975 and an adjusted factor of 2.206403. That returns 5,957 seconds, or 1:39:17, at 4:42 min/km (7:34 min/mile).
Line the three paces up and the pattern is easy to read: 4:30, then 4:42, then 4:54 min/km as the distance quadruples. The model never lets speed hold flat and never lets it collapse. It bends the curve by the same proportion each time the distance doubles, which is both its elegance and its limitation.
The arithmetic also reverses cleanly, which makes a quick sanity check on any implementation. Run the 3:27:01 marathon estimate back towards 10 km through the Riegel race time predictor and it returns 45:00, the time the calculation started from.
One last figure puts the exponent in proportion. Rerun the marathon calculation at 1.10 rather than 1.06 and the estimate moves to 3:39:17. That is 12 minutes and 16 seconds of difference, produced by shifting a single constant by four hundredths.
How to use the race time predictor (Riegel formula)
The Riegel race time predictor takes three inputs: the distance of a race already completed, the time recorded for it, and the target distance. A single toggle switches the whole tool between metric and imperial, so both distance fields always share a unit and the ratio cannot be corrupted by mixing them. The time field is the one to watch, because it wants minutes rather than clock notation. A 1:45:00 half marathon goes in as 105, not as 1.45.
The output is an estimated finish time at the target distance, along with the pace that time implies. It appears as a single figure rather than a range, which is a presentation choice rather than a claim about precision. Reading it to the second overstates what the underlying data supports. Allowing a few seconds per kilometre either side sits closer to honest.
The half marathon to marathon step is where the formula comes under most strain, and the marathon time predictor is built around that single conversion and its known weaknesses. A recent race makes a steadier input than a personal record set three seasons ago, since the equation has no idea when a result was set. Two runners entering identical numbers receive identical answers, because the tool holds nothing about weekly mileage, terrain, heat, or how the last long run went.
Common scenarios
A short step up the distance ladder
A runner with a 25:00 5 km (3.1 mi) wants a 10 km estimate. The ratio is exactly 2, the adjusted factor is 2.0849, and the result is 52:07, a pace of 5:13 min/km (8:23 min/mile). This is the formula at its most reliable. The two efforts draw on similar physiology and both sit comfortably inside the duration range Riegel fitted.
Half marathon to marathon
A 1:45:00 half marathon scales to 3:38:55 for the marathon. This is the most requested conversion in the sport and the one where the model is known to run fast. The marathon introduces fuel depletion, muscle damage and thermoregulation, none of which appear anywhere in a two-variable power law. Runners who treat the figure as a planning anchor commonly find the real result lands several minutes later than the estimate.
Moving between track and road
A 1500 m time of 5:00 scales to 17:55 over 5 km. The arithmetic holds, but a 1500 m result leans on anaerobic capacity and economy at speed, while a 5 km leans towards aerobic power. The formula sees two numbers and cannot know the physiological mix has shifted underneath them.
Reaching past the fitted range
Feed the 45:00 10 km runner a 50 km (31.1 mi) target and the formula returns 4:07:49. That is 248 minutes, past the roughly 230 minute upper bound of the data Riegel worked from. Ultra distance racing also brings in terrain, aid-station stops and stretches of walking, none of which the model contains.
Comparing across age groups and sports
Two runners, one aged 28 and one aged 58, can produce identical Riegel curves while representing very different achievements. The formula scales across distance, not across demographics. An age-graded running performance calculator handles that second dimension against an age and sex reference standard. Swimmers and cyclists run into the same issue by sport, since each discipline carries its own fatigue factor.
Common mistakes and misconceptions
- Reading the output as a target. The figure is a statistical central estimate drawn from population data. It describes what times of that shape have tended to scale to, not what an individual produces on the day.
- Entering time in clock notation. The time field takes minutes, so a 1:45:00 half marathon is 105. Typing 1.45 asks the formula to scale a one minute and twenty-seven second race, and it will happily return an answer. The arithmetic is only ever as sound as the unit it was handed.
- Using a stale input. A personal record from three seasons ago describes fitness that no longer exists. The formula has no sense of when a result was set, and treats a lifetime best exactly as it treats last Sunday's parkrun.
- Confusing the formula with VDOT. Riegel scales one time to another distance. The VDOT system estimates an underlying fitness value, then reads equivalent performances and training paces from tables built on oxygen cost curves. A VDOT calculator (Jack Daniels) and a Riegel predictor commonly disagree by a few minutes over a marathon, and neither is wrong so much as differently calibrated.
- Assuming 1.06 is universal. Riegel himself published different values for different groups, and for recreational runners over the marathon the fitted value usually needs to be higher than 1.06, not lower. That is why the same tool can look accurate for one athlete and generous for another.
Frequently asked questions
Is Riegel formula race prediction accurate?
Accuracy depends on how far apart the two distances sit. Across a modest step up, such as 5 km to 10 km, it tracks real results closely. Across the jump from a half marathon to a full marathon it runs fast. Vickers and Vertosick surveyed 2,303 recreational endurance runners in 2016 and found the formula well calibrated up to the half marathon, while its marathon predictions came in at least ten minutes too quick for about half of runners. On the validation subset they used to score models, the mean squared error for Riegel was 381, against 228 and 208 for the two models they built from prior race times. The output reads better as the centre of a range than as a finish time.
What does the 1.06 exponent in the Riegel formula mean?
The exponent sets how quickly average speed decays as distance grows. At exactly 1.0, doubling the distance would double the time and pace would never slip. At 1.06, doubling the distance multiplies time by 2.0849, so time rises about 4.2 per cent more than a straight doubling. Riegel called this quantity a fatigue factor and published different values for different groups, roughly 1.08 for elite runners and 1.05 to 1.06 for male recreational runners aged 40 to 70. For recreational marathon prediction the fitted value generally needs to be higher still: Vickers and Vertosick found that even 1.08 produced times too fast for around three quarters of their sample.
Can the Riegel formula predict a marathon time from a 5 km race?
Arithmetically yes, and the calculator returns a figure, but the distance ratio is large enough that the estimate carries wide uncertainty. A 5 km result is limited mostly by aerobic power and by tolerance for discomfort across about twenty minutes. A marathon adds fuelling, thermoregulation, muscle damage and pacing discipline, none of which the equation contains. The original fit covered efforts lasting roughly 3.5 to 230 minutes, so a slow marathon sits outside the range the exponent came from. A recent half marathon makes a far more stable input.
Does the Riegel formula work for swimming and cycling?
The power law structure carries over, but the exponent does not. Riegel fitted separate fatigue factors for other sports and for different age and sex groups. Speed does not decay with distance at the same rate in water, on a bicycle and on foot, since drafting, water resistance and equipment all reshape the curve. Applying the running value of 1.06 to a swim or a ride mixes an exponent from one sport with data from another, which is a frequent source of error. Most calculators built on the formula, including this one, assume the running fit.
Sources and methodology
Every figure here was derived from first principles using the equation as published, rounded only at the final step. Distance constants are the official marathon of 42.195 km and half marathon of 21.0975 km, converted at 1.609344 km per mile. The 5 km to 10 km case was cross-checked against the calculator's own worked output, which also returns 52:07.
The formula and its fatigue factors come from:
- Riegel PS. Athletic records and human endurance. American Scientist. 1981;69(3):285-290, the paper setting out the power law and its fatigue factors by sport and demographic group. An earlier version of the formula appeared in Runner's World in 1977.
- Vickers AJ, Vertosick EA. An empirical study of race times in recreational endurance runners. BMC Sports Science, Medicine and Rehabilitation. 2016;8:26, which tested the formula against self-reported results from 2,303 recreational runners. Their main analysis used an exponent of 1.07, with sensitivity checks at 1.06 and 1.08.
A note on spelling and units, since this article is read in a lot of places. Distance appears as kilometre through most of the world and kilometer in the United States, with the same split for metre and meter. Pace is quoted as min/km in metric markets and min/mile in the United States and the United Kingdom, where 5 km is often written 5K. The arithmetic is identical in all of them.
Putting it together
Riegel formula race prediction has survived because it does one thing cleanly. It converts a known result into an equivalent at another distance using a single fitted constant, with every step open to inspection. Its strength across a short step is also the source of its weakness across a long one, because the exponent carries everything the model holds and it was fitted to record performances rather than to a Tuesday night club runner.
Read as a central estimate rather than a forecast, and fed with recent results rather than career bests, the Riegel race time predictor gives a defensible reference point to plan around: what it cannot see, which is terrain, weather, fuelling and pacing, stays where it has always been: with the athlete.
Last updated 12 August 2026.