What are negative splits in running?
A split is the time for one segment of a run, and the pattern across segments is what an average pace hides. This guide sets out even, negative and positive splits, works a 50:00 ten kilometre through a 2 per cent negative split, and shows why thirty seconds is the whole of it.
JCVerified Verified by Jobi Cheriyan, Founder & Builder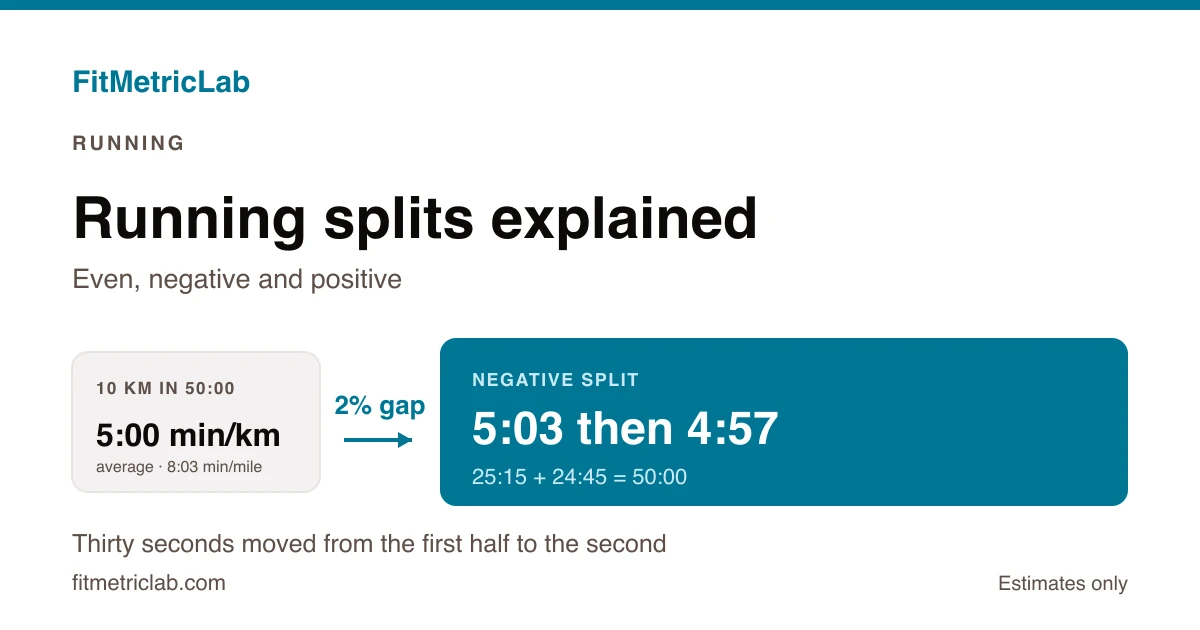
A 10 km (6.21 mi) run finished in 50:00 averages 5:00 min/km (8:03 min/mile). Whether the first half took 25:15 and the second 24:45, or the reverse, the average is identical and the experience is not. That difference is what people mean when they ask what are negative splits in running, and the running splits calculator lays the markers out so the two halves can be compared rather than guessed at.
What are negative splits in running?
A split is the time taken to cover one segment of a race, usually a kilometre, a mile or a named marker such as halfway. A negative split means the second half was covered faster than the first. A positive split is the reverse. An even split means both halves came in at effectively the same pace.
The words describe distribution, not speed. Two runners can finish the same course in the same time on opposite patterns, and the clock will not tell them apart. Only the segment times will.
Why split distribution matters
An average pace hides everything inside it. A 50:00 ten kilometre could be ten steady laps of the clock. It could equally be a fast opening that decayed from the fourth kilometre. Both give the same headline figure, and only the split times tell them apart.
That is what makes splits useful over time. The same course run twice in near-identical totals, once fading and once evenly, gives two different performances behind one number.
Pacing research treats these patterns as a named taxonomy. Abbiss and Laursen catalogue negative, positive, even, all-out, parabolic and variable strategies, each a different shape of effort across a fixed distance. The shape is measurable. Whether one suits a given runner on a given day is a separate question, and not one arithmetic answers.
How the splits are calculated
Even splits come first, because everything else is defined against them. Divide total time by distance for the average pace, then multiply by each marker distance for the cumulative time. That is the whole of it. A deliberate negative split then adjusts around that average: the calculator takes a percentage gap and shares it symmetrically, the first half running half the gap slower and the second half running half the gap faster.
average_pace   = total_time / total_distance

split_time(n)  = average_pace × marker_distance(n)

first_half     = average_pace × (1 + gap / 200)
second_half    = average_pace × (1 - gap / 200)
The variables:
- total_time = run or target time, in minutes
- total_distance = full distance, in kilometres (miles)
- marker_distance(n) = cumulative distance at split n, in kilometres (miles)
- average_pace = time per unit distance, in min/km (min/mile)
- gap = percentage difference between the halves, dimensionless
- first_half, second_half = the two target paces, in min/km (min/mile)
Dividing by 200 rather than 100 keeps the halves centred on the average. A 2 per cent gap moves each half 1 per cent in opposite directions, so the total is unchanged, and a bigger gap separates them further while the finish stays put.
A worked example
Take a target of 10 km (6.21 mi) in 50 minutes, with a 2 per cent gap between the halves.
Step 1. Find the average pace. 50 minutes is 3,000 seconds. Over 10 km that is 300 seconds per kilometre, or 5:00 min/km (8:03 min/mile), which is 12.00 km/h (7.46 mph).
Step 2. Apply half the gap each way. Half of 2 per cent is 1 per cent, so the first half is 300 × 1.01 = 303 seconds per kilometre and the second is 300 × 0.99 = 297.
Step 3. Convert back to pace. 303 seconds is 5:03 min/km (8:08 min/mile), 297 is 4:57 min/km (7:58 min/mile). Six seconds per kilometre separate them.
Step 4. Check the halves add up. Five kilometres at 303 seconds is 1,515, or 25:15. Five at 297 is 1,485, or 24:45. Together 3,000 seconds exactly, the 50:00 the calculation started from.
Thirty seconds moved from the first half to the second. That is the whole of a 2 per cent negative split at this pace, smaller than most runners expect. The negative split pace calculator takes a time, a distance and the gap, then returns the two paces. Sizing a gap beforehand beats reconstructing one afterwards.
How to use the Running Splits Calculator
The running splits calculator takes three inputs: total distance, total time in minutes, and the length of each split. A unit toggle switches distance between kilometres and miles. The time field wants decimal minutes, so a 50:30 run is entered as 50.5, not 50.30.
The headline output states how many whole splits the distance holds and the time each takes at the average pace. Below it sits the cumulative time at every marker, the part worth reading on the move: at 3 km the clock reads 15:00, with no mental arithmetic needed mid-run.
Distances that do not divide evenly get a marker of their own, so a marathon at 42.195 km (26.22 mi) with 1 km splits gives 42 markers plus a final 0.195 km. Long lists are abridged rather than truncated: the opening markers show, then a count of those skipped, then the finish. The finish is never the row that gets dropped. For a plain average with no markers, the running pace calculator converts time and distance into pace and speed.
Common scenarios
A 5 km on a measured course
Weekly timed 5 km (3.11 mi) events are the most repeated distance in the sport, which makes them a natural place to compare patterns. Same course, same markers, week after week. Tracking one across a season, the shape often moves before the total does, with the fade arriving later in the run weeks before the finishing time shifts.
Marathon halves
Distribution shows up most starkly here, because the second half is long enough for an ambitious opening to cost minutes. Halfway sits at 21.0975 km (13.11 mi), and the gap between halves is where most post-race analysis starts. A marathon splits calculator works markers back from a target finish.
Track intervals
One lap of lane one on a standard outdoor track is 400 m (1,312 ft), so splits here are lap times. The arithmetic is unchanged: total time over laps gives the average, and each lap is read against it. Interval sessions make the drift obvious, since one effort repeated eight times rarely gives eight identical laps.
Common mistakes and misconceptions
- Treating a negative split as a measure of quality. It describes shape, nothing more. A very cautious opening produces one by leaving time on the course, and the pattern alone cannot distinguish that from a well-judged race.
- Entering clock time as decimals. A 50:30 run is 50.5 minutes, not 50.30. The calculator accepts 50.30, reads it as 50 minutes 18 seconds and returns splits for a run twelve seconds shorter, with no warning. Satellite distance carries a similar quiet error: a watch recording 10.15 km on a certified 10 km reports every split slightly fast.
- Confusing splits with pace. A split is a time for a segment; pace is time per unit distance. They coincide only when the split length is one unit, which is why 1 km splits and min/km pace look identical on a 10 km and diverge the moment the split length changes.
Frequently asked questions
What are negative splits in running, in one sentence?
A negative split means the second half of a run was covered faster than the first, so the closing segment times are quicker than the opening ones. It describes how effort was distributed, not how fast the run was overall: two runs with identical finishing times can carry opposite patterns. The comparison is usually between halves, though it applies to any pair of segments, such as the first and last 5 km (3.11 mi) of a marathon. Splits make that visible; an average pace cannot.
How much faster should the second half be?
There is no single figure, and the arithmetic does not supply one. What it does show is how small a percentage gap looks in practice. Held at five minutes a kilometre, a 2 per cent gap separates the halves by six seconds per kilometre: 5:03 against 4:57 min/km. A 4 per cent gap doubles that. Larger gaps shift more time from the opening to the close while leaving the total untouched, so the choice is about distributing effort rather than a target the numbers can set.
Do world records tend to be run as even splits?
Analyses of record performances have looked at exactly this. Tucker, Lambert and Noakes examined the pacing in men's world records over 800 m, 5000 m and 10,000 m, and the wider literature summarised by Abbiss and Laursen groups such performances into named strategies rather than treating pacing as random. Those analyses describe elite competition over track distances under record conditions, a narrow setting. Extending a pattern from there to a recreational road race is a considerable leap, since field, terrain, weather and tactics all differ.
Is a positive split always a pacing error?
No. A positive split simply means the first half was faster. On a course with a hilly opening and a downhill finish the terrain alone moves the pattern, and in shorter track events an early acceleration is part of how a race is contested. Course profile, wind and the tactics of a mass-start field shift the shape independently of judgement. The pattern records what happened; the reason is not in the numbers, and reading one split table as a verdict on pacing overstates what it holds.
Sources and methodology
Every figure above was computed from the stated inputs and checked against the calculator's output. The 50:00 ten kilometre resolves to 300 seconds per kilometre exactly, and the halves of the 2 per cent example sum to 3,000 seconds with nothing left over. Imperial equivalents use 1.609344 kilometres per mile, an exact defined value.
The pacing terminology follows two peer-reviewed sources:
- Abbiss CR, Laursen PB. Describing and understanding pacing strategies during athletic competition. Sports Medicine. 2008;38(3):239-252, which sets out the negative, positive, even, all-out, parabolic and variable categories used here.
- Tucker R, Lambert MI, Noakes TD. An analysis of pacing strategies during men's world-record performances in track athletics. International Journal of Sports Physiology and Performance. 2006;1(3):233-245, examining how pacing was distributed in record performances over 800 m, 5000 m and 10,000 m.
On wording: distance is kilometre in most of the world and kilometer in the United States, with the same split for metre and meter. Pace runs in min/km in metric markets and min/mile in the United States and the United Kingdom, where a 5 km event is often written 5K.
Putting it together
Splits turn one number into a sequence. A finishing time says what a run added up to; the segment times say how it was assembled, and only the second tells a steady effort from a fast opening that faded to the same result. Negative, even and positive name the three shapes.
The arithmetic underneath is ordinary division, which is what makes it checkable: an average pace, a marker distance, a percentage shared across two halves. Running a target through the running splits calculator gives the marker times to read against on the day, and running the finished race back through it shows which shape the effort took.
Last updated 7 September 2026.