What Is VDOT?
VDOT turns one race result into a single running fitness score on the VO2max scale. This guide sets out both Daniels–Gilbert equations in full, works a 45:00 ten kilometre through to 45.3 step by step, and marks the durations where the model quietly stops meaning what it says.
JCVerified Verified by Jobi Cheriyan, Founder & Builder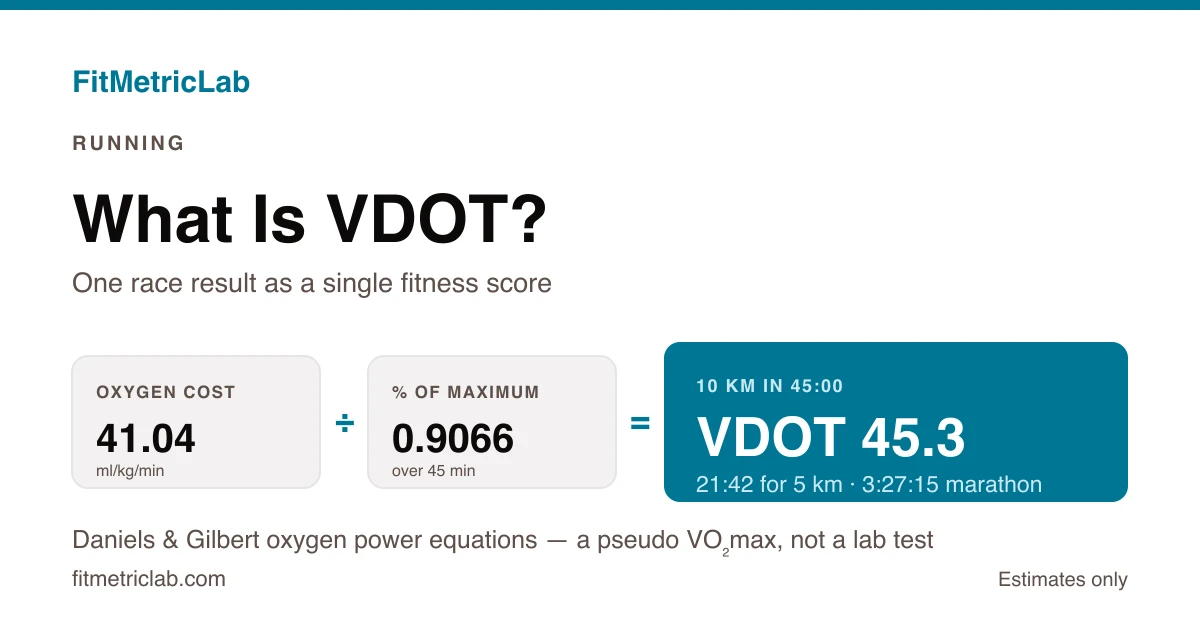
Two runners finish the same 10 km (6.21 mile) race. One stops the clock at 45:00, the other at 50:00. Five minutes apart — and neither time, on its own, says much about how fit either runner actually is, or what pace either of them trains at on Tuesday.
Run both results through the same pair of equations and they come out as 45.3 and 40.0. Those are VDOT scores, and they are the answer to a question runners have been asking since the 1970s: what is VDOT, and can one number really stand in for a season of race results? The VDOT calculator (Jack Daniels) runs the same two equations, so both of those scores can be reproduced rather than taken on trust.
What is VDOT? A plain English definition
VDOT is a pseudo VO2max: a single number, sitting on the same scale as maximal oxygen uptake, describing how fast a runner can race today. It is not what a laboratory would measure on a treadmill, and the difference matters more than the shared scale suggests.
The name is an accident of typography. Physiologists write oxygen uptake as a V with a dot above it, and typing flattens that into V DOT.
The calculation needs two things: one race distance and one race time. From those it works out the oxygen cost of that speed, then divides by the fraction of maximum a runner can hold for that long. Body mass, age, sex and training history never appear, because the race result has already absorbed all of them. Two athletes with the same score are, by this model, equally fit for racing — whatever the route each took to get there.
Why one number beats a list of race times
Raw times resist comparison. A 21:42 five kilometre and a 1:39:44 half marathon look nothing alike, and no amount of squinting at a spreadsheet turns one into the other. Both sit at the same VDOT, so the model treats them as identical running fitness expressed over different distances. Fold distance and time into one figure and a season becomes legible: three races, three distances, one trend line.
The second use is prescription. Once the number exists, every training intensity can be written as a percentage of it, which is how a score becomes an easy pace, a threshold pace and an interval pace. A training pace calculator (from VDOT) handles that conversion.
Pace alone cannot do this job. The same 4:30 min/km (7:15 min/mile) is a jog for one runner, a threshold effort for another and a personal best for a third, and nothing in the pace itself distinguishes the three.
How VDOT is calculated
The VDOT equations are two curves, and between them they carry the whole model. The first prices the oxygen cost of a running speed, in millilitres of oxygen per kilogram of body mass per minute. The second gives the fraction of maximum a runner can sustain for a given duration — a fraction that falls as the race gets longer.
VDOT = VO2 / %VO2max

VO2     = -4.60 + 0.182258 * v + 0.000104 * v^2

%VO2max = 0.8 + 0.1894393 * e^(-0.012778 * t)
              + 0.2989558 * e^(-0.1932605 * t)
The variables:
- v = race velocity in metres per minute. The coefficients were fitted in these units, so miles per hour or metres per second have to be converted before the equation will return anything sensible.
- t = race time in minutes, expressed as a decimal rather than as minutes and seconds. A 45:30 race is 45.5, not 45.30.
- VO2 = oxygen cost of that velocity, in millilitres per kilogram per minute. Oxygen uptake is reported in metric units everywhere, so there is no imperial equivalent in circulation.
- %VO2max = the sustainable fraction of maximum, written as a decimal.
- e = the base of natural logarithms, roughly 2.71828.
Time enters twice: once inside the velocity, once inside the fraction. Lengthen the race and both exponential terms shrink, dragging the fraction down with them. That is the mechanism behind the model's most useful trick — a slower marathon pace returning the same score as a faster 5 km.
A worked example, step by step
Take the first of the two runners from the top: 10 km (6.21 miles) in 45:00, an average of 4:30 min/km (7:15 min/mile).
Step 1 — velocity. 10,000 metres divided by 45 minutes gives 222.222 m/min (729 ft/min), which is 13.33 km/h (8.28 mph).
Step 2 — oxygen cost. That velocity goes into the first equation:
VO2 = -4.60 + 0.182258 * 222.222 + 0.000104 * 222.222^2
    = -4.60 + 40.5018 + 5.1358
    = 41.0376 ml/kg/min
Step 3 — sustainable fraction. 45 minutes goes into the second equation. The two exponential terms come out at 0.10660 and 0.00005:
%VO2max = 0.8 + 0.10660 + 0.00005 = 0.906647In words: a 45 minute race effort runs at about 90.7 per cent of maximum. The second exponential has all but disappeared by this duration, the fast-decaying term that is usually read as the anaerobic contribution, and by three quarters of an hour it has faded to nothing.
Step 4 — divide. 41.0376 divided by 0.906647 gives 45.263, which the calculator reports as 45.3.
Now the second runner, the one who took 50:00 for the same course. Velocity drops to 200 m/min and oxygen cost to 36.01 ml/kg/min, while the sustainable fraction falls to 0.900 because the effort lasted longer. Divide one by the other and the score lands at 40.0.
Five minutes over 10 km is worth roughly five VDOT points at this end of the scale.
From 45.3, the equivalent performances run right across the range: 5:54 for 1500 m, 21:42 for 5 km, 1:39:44 for the half marathon and 3:27:15 for the marathon. Every one of those falls out of the same two equations solved in reverse.
Where the model stops working
The sustainable fraction is often described as a number between 0 and 1. It is not, and the exception is worth understanding rather than glossing over.
Solve the second equation at short durations and it returns values above 1.00 — 1.0100 at ten minutes, 1.0915 at five, 1.2335 at one. The crossover sits at roughly eleven minutes. Below that, the model is describing a runner working above the rate aerobic metabolism alone could supply, with the shortfall covered anaerobically. The arithmetic still runs, and the scores it produces are still usable, but the phrase "percentage of maximum" has quietly stopped being literal.
At the other end the fraction settles towards 0.80 and stays there. Two hours gives 0.841, three hours 0.819, four hours 0.809. The equation cannot go below 0.80 no matter how long the race, which is why ultra distances sit outside what it was built for: it declines to model the collapse in sustainable intensity that anyone who has run 100 km will describe at length.
The practical envelope runs from about 1500 m to the marathon, on flat courses, from all-out efforts. Inside that range the equations were fitted to real data. Outside it, they are extrapolating.
How to use the VDOT Calculator (Jack Daniels)
The Jack Daniels VDOT calculator takes two inputs and nothing else. The first is the race distance, entered in kilometres or miles depending on the unit toggle, so no conversion is needed. The second is the finishing time in minutes as a decimal — a 45:00 race is entered as 45, and a 45:30 race as 45.5.
The output is the score to one decimal place. Equivalent race times and training paces come from separate tools rather than from this one: the training pace calculator converts a score into easy, marathon, threshold and interval paces, and the race time predictor (Riegel formula) handles equivalent distances by a different route.
Read the result as a snapshot of the fitness on show that day, not a ceiling. A time set in heat, into a headwind, on a course with 200 m of climbing, or in the middle of a heavy training block carries all of those conditions into the number, and the model has no way to strip them back out. Runners on hilly courses sometimes pair the result with an elevation-adjusted pace calculator to get a rough sense of what the terrain cost them.
How VDOT compares with the Riegel formula
The other common way to turn one race into another is the endurance formula devised by the American engineer Peter Riegel, which raises the distance ratio to the power 1.06 and has no physiology in it whatsoever. No oxygen cost, no sustainable fraction, no shared algebra with Daniels and Gilbert.
Given the same 45:00 ten kilometre, the two models land remarkably close together:
- 5 km — VDOT 21:42, Riegel 21:35. Seven seconds apart.
- Half marathon — VDOT 1:39:44, Riegel 1:39:17. Twenty-seven seconds apart.
- Marathon — VDOT 3:27:15, Riegel 3:27:01. Fourteen seconds apart.
Two models built on entirely different premises, agreeing to within half a minute at every distance from 5 km to the marathon. That convergence is the strongest evidence either one is describing something real. It is also the clearest signal of what both are doing: fitting a smooth curve to how human race times scale with distance, and doing it well, without either one knowing anything about the particular runner in front of it.
Common scenarios
A weekly timed 5 km as the input
Free, measured, timed 5 km events now run in more than twenty countries, and they make an unusually good input: same course, same distance, repeatable indefinitely. A score taken from one of them moves week to week with form, weather and how honest the effort was. Runners comparing a July result against a January one on the same course see the seasonal swing in plain numbers rather than in vague impressions.
Training in miles, racing in kilometres
Plenty of runners — across the United States, the United Kingdom and Ireland in particular — log their weeks in miles while entering metric races. VDOT sidesteps the mismatch entirely by working in oxygen units. A 6.21 mile race and a 10 km race are the same input, and the paces that come out can be read back in min/km or min/mile without anything being lost in between.
Masters runners tracking a moving target
An absolute score drifts downwards with age even when training holds steady, which makes year-on-year comparison discouraging and slightly misleading. Age grading answers a different question — how a performance compares with the standard for that age and sex — and an age-graded running performance calculator sits naturally alongside the VDOT score rather than replacing it.
Multisport athletes checking run fitness
Triathletes and duathletes carry cycling and swimming fitness that a running model cannot see. A score taken from a standalone running race describes standalone running fitness, and the paces derived from it tend to be quicker than what is sustainable off the bike. Treating the two as interchangeable is where the number stops being useful.
Common mistakes and misconceptions
- Reading VDOT as laboratory VO2max. The two share a scale and very little else. A runner with excellent economy scores higher than a laboratory test would suggest, because economy and fractional utilisation are folded into the same figure and cannot be separated out again afterwards.
- Assuming equal pace means equal fitness. A 5 km in 25:00 and a 10 km in 50:00 are both 5:00 min/km (8:03 min/mile). They score 38.3 and 40.0, because holding a pace for twice as long is the harder feat and the model prices it accordingly.
- Using a steady training run as the input. The equations assume a maximal effort over the full distance. A comfortable long run entered as a race returns a score well below current fitness, and any training paces drawn from it inherit the error.
- Treating the marathon equivalent as a promise. A marathon time projected from a 5 km score assumes the endurance work behind it has actually been done. The equations model oxygen cost. They know nothing about fuelling, heat, or what happens after 32 km.
- Chasing the number week to week. Race-to-race variation is dominated by weather, terrain, sleep and pacing. Reading every wobble as a fitness change generates a lot of anxiety and very little signal.
The short version: VDOT describes the race already run. Everything it says about races not yet run is extrapolation.
Frequently asked questions
What is a good VDOT score?
There is no universal threshold, because the scale runs continuously from beginner to world class and shifts with age, sex and event. As rough orientation, recreational runners commonly sit in the 30s and 40s, competitive club runners in the 50s and 60s, and elite distance specialists above 70. Comparing a figure against its own history across a season is more informative than comparing it with anyone else's, since identical training produces different absolute numbers in different bodies. The score describes racing performance only, and says nothing about health, body composition or how much anyone enjoys running.
Is VDOT the same as VO2max?
No, though the two share a scale. VO2max is measured directly in a laboratory, with the athlete breathing into a gas analyser during a graded test to exhaustion. VDOT is inferred from a race result, and it bundles three things together: maximal oxygen uptake, running economy, and the fraction of maximum sustainable for that duration. Two runners with identical laboratory values can post very different scores if one is more economical than the other, and a single race result offers no way to tell which of the three is doing the work.
Can VDOT be calculated without racing?
The VDOT equations need only a distance and a time, so any all-out time trial works, with accuracy depending on how close that effort came to a genuine race. Solo time trials tend to run slower than race day for pacing and motivation reasons, which pushes the resulting figure down. Repeating the same course and distance each time keeps the comparison honest even when the absolute number sits a little low, since the bias applies equally to every attempt.
How often does VDOT change?
Meaningfully, over blocks of six to twelve weeks rather than week to week. The underlying adaptations that matter here, among them plasma volume, capillary density, mitochondrial content and running economy, all move on roughly that timescale. Day-to-day variation in a race result comes mostly from weather, terrain, sleep and pacing rather than from any real change in fitness. One common approach is to update the score after each genuine race and leave it alone in between, which keeps training paces stable long enough for a block to do its work.
Why do my 5 km and marathon scores disagree?
Because the model assumes both efforts were maximal and that the endurance work behind the longer one was in place, and one of those assumptions usually is not. A score from 5 km sitting several points above the marathon score typically points to a speed base outrunning the endurance base, which is common in runners moving up in distance. The gap tends to narrow as marathon-specific volume accumulates. Neither figure is wrong; they are measuring different things and reporting on the same scale.
Sources and methodology
The two equations reproduced above are the oxygen power equations published by Jack Daniels (1933–2025) and Jimmy Gilbert in 1979, in Oxygen Power: Performance Tables for Distance Runners. Daniels was an American exercise physiologist, a two-time Olympic medallist in modern pentathlon, and a collegiate coach for close to six decades. The equations remain the basis of the VDOT tables in every edition of Daniels' Running Formula, from the first in 1998 through to the fourth.
Every figure on this page was recomputed from the equations directly rather than read off a published table, and the intermediate values are shown so the arithmetic can be checked independently. Equivalent race times were found by solving the same equations numerically for the time that reproduces a score of 45.263. Riegel comparisons use the standard 1.06 exponent.
Two peer-reviewed reviews cover the physiology the model compresses. Joyner and Coyle set out how maximal oxygen uptake, lactate threshold and running efficiency interact to determine endurance performance, which is the clearest explanation of why one figure can stand in for three. Bassett and Howley examine what limits maximal oxygen uptake in the first place, and how tightly it relates to performance.
Runners wanting the underlying pace arithmetic without any physiological modelling attached can use a plain running pace calculator, which converts time and distance and stops there.
Putting it together
So, what is VDOT? The Jack Daniels VDOT model answers one narrow question: given a single honest race, how fit is this runner right now, and what paces follow from that. It gets there by pricing the oxygen cost of speed, then the fade in sustainable intensity as races lengthen, and folding both into one figure on the VO2max scale.
The 45:00 ten kilometre worked through above returns 45.3. The 50:00 returns 40.0. Everything else — 1500 m to the marathon, easy pace to interval pace — follows from those two figures, and holds best when the training behind them matches the distance being predicted.
What the number cannot do is tell anyone whether a good day was fitness or weather. That is what repetition is for. Running each fresh race through the VDOT calculator and watching the trend across a season separates the signal from the noise far better than any single result, however satisfying that result happened to be.
Last updated 10 August 2026.