Harris-Benedict vs Mifflin-St Jeor: which BMR formula?
Two respected BMR equations return different resting energy figures from identical inputs. This post walks through both sets of coefficients, a fully worked example and how far apart the estimates typically sit.
JCVerified Verified by Jobi Cheriyan, Founder & Builder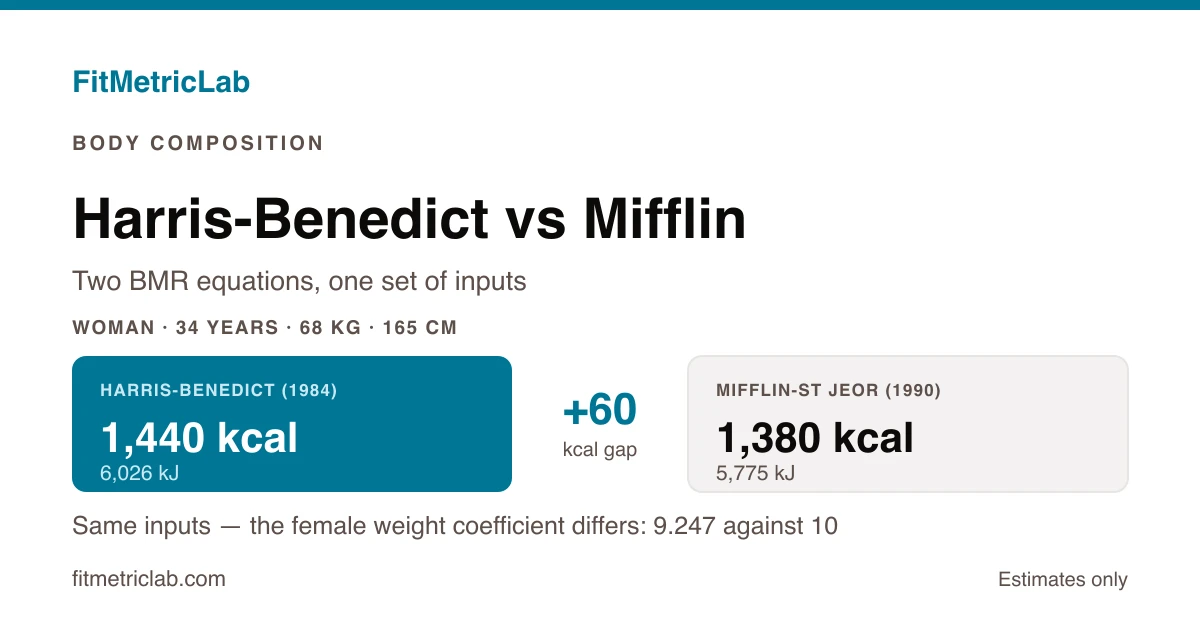
A 34-year-old woman weighs 68 kg (150 lb) and stands 165 cm (5 ft 5 in). Two calculators can hand her two different resting energy figures from those same three numbers. One returns about 1,440 kcal (6,026 kJ) a day, the other about 1,380 kcal (5,775 kJ). That 60 kcal gap is what Harris-Benedict vs Mifflin comes down to.
Neither figure is wrong. They are two population-level regressions, fitted to different samples seven decades apart, and they disagree in directions that turn out to be predictable once the coefficients are on the table. The Harris-Benedict BMR calculator returns the first of those numbers. This article covers where the second comes from, how far apart the two usually sit, and which inputs widen the gap.
What does Harris-Benedict vs Mifflin actually compare?
Both equations estimate basal metabolic rate: the energy a body uses at complete rest, lying still, in a neutral temperature, several hours after eating. That is the floor of daily energy use, not the total.
Harris-Benedict descends from measurements published in 1918 and reworked in 1984. The Mifflin-St Jeor equation came out of a 1990 study built on a larger, more recent sample: 498 adults against the 239 behind the original.
Both take the same four inputs, weight them differently, and return a figure in kcal per day. Neither measures anything directly. Both predict basal metabolic rate from height, body mass, age and sex.
Why the choice of BMR formula matters
Basal metabolic rate is usually the largest single component of daily energy use, and most tracking tools build every downstream figure on top of it. Total daily energy expenditure multiplies it by an activity factor. The 60 kcal difference above becomes 93 kcal once a moderate multiplier of 1.55 is applied: 2,233 kcal against 2,139 kcal.
The gap also runs in a consistent direction. Harris-Benedict usually returns the higher of the two figures, and the reason sits in the weight terms. For men it applies 13.397 per kilogram against the flat 10 used by Mifflin-St Jeor, so the gap widens as body mass rises. For women the Harris-Benedict weight coefficient is 9.247, which sits below 10, so the gap narrows instead.
Direction of the gap: for men it widens with body mass, for women it narrows. Same pair of equations, opposite behaviour.
How each formula is calculated
Harris-Benedict vs Mifflin is, mechanically, a difference in coefficients. Both are linear equations: multiply body mass by one number, height by another, age by a third, then apply a constant that depends on sex. The revised Harris-Benedict coefficients (Roza and Shizgal, 1984) are the set most calculators implement. The 1918 originals differ slightly and are rarely used now.
Harris-Benedict (revised, 1984)
  Men:   BMR = 88.362 + (13.397 x weight) + (4.799 x height) - (5.677 x age)
  Women: BMR = 447.593 + (9.247 x weight) + (3.098 x height) - (4.330 x age)

Mifflin-St Jeor (1990)
  Men:   BMR = (10 x weight) + (6.25 x height) - (5 x age) + 5
  Women: BMR = (10 x weight) + (6.25 x height) - (5 x age) - 161
Where:
- weight = body mass in kilograms, kg (lb)
- height = standing height in centimetres, cm (in)
- age = age in whole years
- BMR = the estimate returned, in kilocalories per day, kcal (kJ). Food labels print kilojoules alongside or instead of Calories in several markets
Two structural differences matter. Harris-Benedict applies separate height coefficients to men and women, 4.799 and 3.098. Mifflin-St Jeor uses 6.25 for both, then shifts the whole line with a single constant, plus 5 or minus 161.
Those constants set where each line starts. The weight coefficients set how fast the two lines pull apart, which is why the spread between them tracks body mass rather than staying fixed.
A worked example
Priya is 34, weighs 68 kg (150 lb) and stands 165 cm (5 ft 5 in). Running both female equations on identical inputs gives:
Harris-Benedict (revised)
- 9.247 x 68 = 628.80
- 3.098 x 165 = 511.17
- 4.330 x 34 = 147.22
- 447.593 + 628.80 + 511.17 - 147.22 = 1,440.34
Mifflin-St Jeor
- 10 x 68 = 680.00
- 6.25 x 165 = 1,031.25
- 5 x 34 = 170.00
- 680.00 + 1,031.25 - 170.00 - 161 = 1,380.25
Rounded once, at the end, that is 1,440 kcal (6,026 kJ) against 1,380 kcal (5,775 kJ). The gap is 60 kcal, or 4.4% above the Mifflin-St Jeor figure. Entering the same three measurements into the Harris-Benedict BMR calculator returns the first result, and the Mifflin-St Jeor BMR calculator returns the second.
Holding height, age and sex fixed and varying only body mass shows how the spread behaves across a range:
| Body mass | Harris-Benedict | Mifflin-St Jeor | Difference |
|---|---|---|---|
| Man, 60 kg (132 lb) | 1,519 kcal | 1,518 kcal | +2 kcal |
| Man, 75 kg (165 lb) | 1,720 kcal | 1,668 kcal | +53 kcal |
| Man, 90 kg (198 lb) | 1,921 kcal | 1,818 kcal | +104 kcal |
| Man, 120 kg (265 lb) | 2,323 kcal | 2,118 kcal | +206 kcal |
| Woman, 50 kg (110 lb) | 1,274 kcal | 1,200 kcal | +74 kcal |
| Woman, 68 kg (150 lb) | 1,440 kcal | 1,380 kcal | +60 kcal |
| Woman, 85 kg (187 lb) | 1,598 kcal | 1,550 kcal | +47 kcal |
| Woman, 110 kg (243 lb) | 1,829 kcal | 1,800 kcal | +28 kcal |
How to use the BMR calculator (Harris-Benedict)
The Harris-Benedict BMR calculator takes four inputs: sex, age in whole years, body mass in kg (lb) and standing height in cm (in). A metric and imperial switch sits above the fields, and imperial entries are converted before the equation runs, so a weight typed in pounds and its kilogram equivalent return the same result.
The output is a single daily figure in kcal, labelled as the 1984 revision, with the per-hour equivalent alongside it. The number describes resting energy alone, before movement, digestion or training enter the picture.
Carrying it into the TDEE calculator applies an activity multiplier and produces the total daily figure most trackers display; the next-steps link under the result passes the BMR across without retyping. Reading the result as a range rather than a point is closer to how the regression behaves. Roza and Shizgal put the precision of the Harris-Benedict equation at about plus or minus 14% in normally nourished adults.
Common scenarios
A lifter carrying high lean mass
A 28-year-old man of 95 kg (209 lb) and 185 cm (6 ft 1 in) gets 2,090 kcal from Harris-Benedict. Mifflin-St Jeor returns 1,971 kcal, a spread of 119 kcal. At 15% body fat his lean mass is 80.75 kg (178 lb), and the Katch-McArdle BMR calculator returns 2,114 kcal, because it reads composition rather than total mass.
An endurance runner tracking across a season
Body mass shifts through a training block, and the two equations respond at different rates. Take a man of 178 cm (5 ft 10 in), aged 40. Moving from 90 kg (198 lb) to 75 kg (165 lb) drops the Harris-Benedict estimate by 201 kcal and the Mifflin-St Jeor estimate by 150 kcal. Comparing across a season means holding the equation constant.
Comparing figures between two apps
Two trackers fed identical measurements can differ by 5% or more without either being faulty. Checking which equation each one runs, and whether a Harris-Benedict figure is the 1918 original or the 1984 revision, usually accounts for the difference. Recording the equation name alongside the number keeps a log readable years later.
Common mistakes and misconceptions
- Treating an estimate as a measurement. Both equations are regressions fitted to a few hundred people. Indirect calorimetry measures. These predict.
- Mixing units mid-calculation. Height in inches entered where the equation expects centimetres shrinks that term by a factor of about 2.5. In Mifflin-St Jeor, 65 in read as 65 cm strips roughly 625 kcal out of the estimate. The error runs the other way for mass: 150 lb read as 150 kg adds about 820 kcal.
- Confusing BMR with TDEE: basal rate excludes movement, digestion and training, so a BMR figure from one tool set against a TDEE figure from another compares two different quantities.
- Switching equations part way through a log. The difference between two dates then reflects the change of formula as much as any change in the body.
Frequently asked questions
Which is more accurate, Harris-Benedict or Mifflin-St Jeor?
Published comparisons generally place Mifflin-St Jeor closer to measured resting energy expenditure in contemporary adult populations, which is why many clinical and sports science settings default to it. Its sample was larger too: 498 adults, against the 239 behind the original Harris-Benedict equation and 337 in the 1984 revision. Accuracy here is a population-level property, though, and for any single person either equation can land several hundred kcal from an indirect calorimetry measurement. Both work as starting points, refined against observed body mass trends over several weeks, rather than as fixed values for one individual.
Why does Harris-Benedict give a higher number than Mifflin?
The difference sits in the weight term: for men, Harris-Benedict applies 13.397 per kilogram against the flat 10 in the Mifflin-St Jeor equation, so the gap grows with body mass. At 178 cm (5 ft 10 in) and age 40, 60 kg (132 lb) gives a difference of about 2 kcal, and 120 kg (265 lb) about 206 kcal. Below roughly 59.5 kg at that height and age the order reverses, and Mifflin-St Jeor returns the higher figure. For women the weight coefficient of 9.247 sits below 10, so the gap shrinks as mass rises. At 165 cm (5 ft 5 in) and age 34, it runs from roughly 74 kcal at 50 kg (110 lb) to roughly 28 kcal at 110 kg (243 lb).
Is the Harris-Benedict equation still worth using?
It remains in wide use more than a century after the original paper, and the 1984 revision keeps it serviceable. Its limitation is the sample: a few hundred adults, measured with equipment of the period, across a narrower range of body composition than a general population covers today. Where a body fat percentage is available, an equation reading lean mass directly, such as Katch-McArdle, tends to track composition more closely: where only height, body mass, age and sex are known, both equations remain reasonable estimators for most adults.
How much difference does the formula choice make in practice?
In the worked example above, 60 kcal at rest, rising to 93 kcal once a moderate activity multiplier of 1.55 is applied. As a rule of thumb, the spread between the two equations stays inside 10% for most adults in the middle of the height and weight range. It widens towards the edges. Set against day-to-day variation in intake, activity and measurement conditions, that spread is narrower than it looks on the screen. Holding one equation constant across a tracking period typically matters more than the choice between them.
Sources and methodology
The equations reproduced here come from the original and revised publications rather than secondary summaries. Every figure in this article, including the comparison table, was recalculated from the coefficients above and rounded once, at the end. Kilojoule equivalents use 1 kcal = 4.184 kJ. The plus or minus 14% precision figure is reported by Roza and Shizgal (1984).
- Harris and Benedict (1918), a biometric study of human basal metabolism, Proceedings of the National Academy of Sciences 4(12), 370–373
- Mifflin and colleagues (1990), a new predictive equation for resting energy expenditure, American Journal of Clinical Nutrition 51(2), 241–247
- Roza and Shizgal (1984), the Harris-Benedict equation reevaluated, American Journal of Clinical Nutrition 40(1), 168–182
Putting it together
Harris-Benedict vs Mifflin asks which regression sits closer to a given body, and the candid answer is that both carry individual error bars wider than the gap between them. Mifflin-St Jeor generally tracks contemporary measured values more closely. Harris-Benedict usually returns the higher figure, by a margin widening with body mass for men and narrowing for women.
The practical consequence is smaller than the comparison suggests: consistency across a tracking period does more work than the choice itself. Either equation returns a starting point, and observed change over several weeks is what turns it into something specific to one person.
Last updated 31 July 2026.