How Many Calories Does Cycling Burn?
Cycling calorie burn is estimated from body mass, a MET value and duration rather than measured directly. This post sets out the equation, works one 45 minute ride through in full, and shows why gross, net and the two rival MET definitions rarely agree.
JCVerified Verified by Jobi Cheriyan, Founder & Builder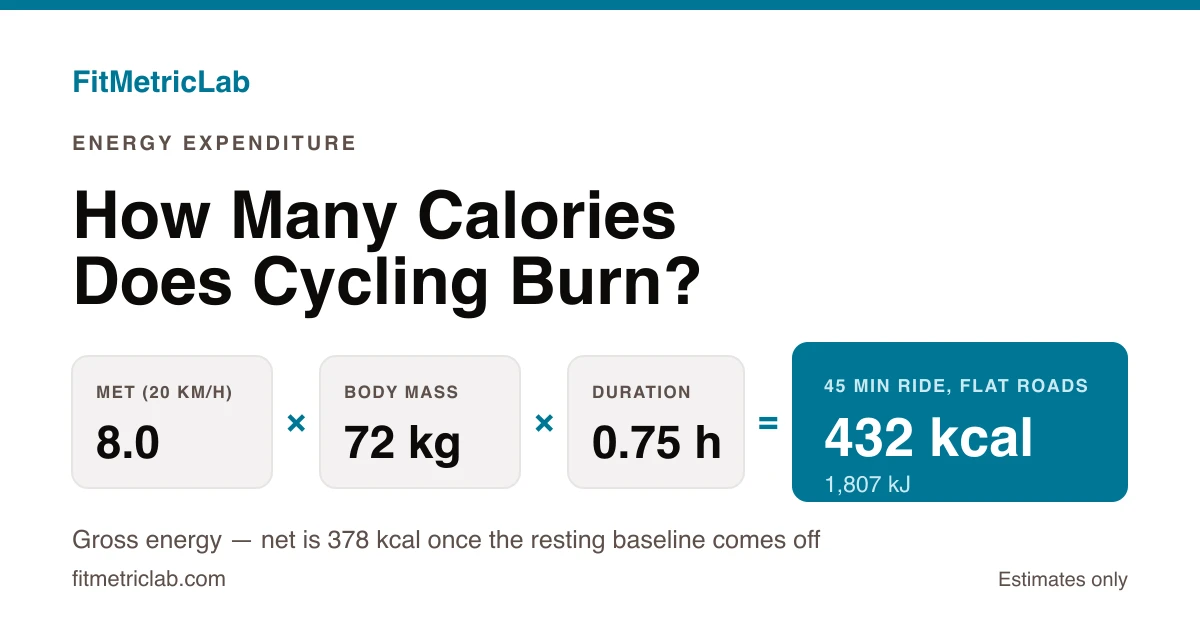
A rider of 72 kg (159 lb) spends 45 minutes on flat roads at a steady 20 km/h (12.4 mph). Put that through the MET method and it returns 432 kcal, or 1,807 kJ. Put a rider 20 kg heavier on the same wheel, at the same speed, for the same 45 minutes, and the estimate climbs by nearly 28% to 552 kcal. Neither rider did anything different.
Run that identical ride through the version of the formula printed on most other sites and you get 454 kcal instead: same method, same inputs, 5% apart, and neither figure is wrong. So how many calories does cycling burn, and where does the number actually come from? This post sets out the equation, names every input feeding it, and works one session through in full arithmetic. The cycling calorie burn calculator runs the same method on your own mass, pace and duration.
What cycling calorie burn actually measures
Cycling calorie burn estimates the chemical energy your body converts while riding. It is reported in kilocalories (kcal) or kilojoules (kJ) depending on where you are. Australian and much of European labelling leads with kilojoules, many other countries lead with kilocalories, and packaging in the United States and Canada prints Calories with a capital C, which means exactly one kilocalorie. One kcal is 4.184 kJ. Same energy, three conventions.
Whichever unit appears on screen, the figure is a model output rather than a measurement. Most tools report the gross number, which folds in the resting energy you would have spent anyway sitting on the sofa. It says nothing about fat loss.
This distinction matters more on a bike than almost anywhere else, because a bike is covered in genuine sensors. Speed comes off a magnet or GPS. Cadence comes off a crank sensor. Power comes off strain gauges in the spider or the pedals. Energy expenditure comes off none of them. It is inferred, downstream, from an equation that was never calibrated to you specifically.
Why cycling calorie estimates matter
Energy expenditure is the one number that puts unrelated activities on a shared scale. A 90 minute ride, a 30 minute swim and an afternoon digging the garden have nothing obviously in common until each is expressed in kilocalories. That shared unit is the whole point of an activity calorie comparison calculator.
The figure also feeds upward. Daily energy expenditure is conventionally divided into resting metabolism, the thermic effect of food, and the energy cost of movement. Cycling sits in that third bucket, and for someone commuting ten times a week the calories burned cycling component can dominate it outright. Anyone tracking a total daily energy expenditure figure is leaning on an activity estimate of this kind, whether or not the tool says so.
There is a quieter use for the number, and it may be the most valuable one: it works as a sanity check on effort. Plenty of riders believe a gentle hour returns 900 kcal and a hard hour returns 950. Seeing the arithmetic corrects that picture faster than any perceived exertion scale, because the equation rewards duration and intensity in proportions that are genuinely hard to feel from the saddle.
If you want calories burned per hour rather than a session total, the per minute rate falls straight out of the same equation. None of this turns the estimate into a target. It describes a ride that already happened.
How many calories does cycling burn: the formula explained
The dominant method uses metabolic equivalents, or METs. FitMetricLab's tools apply the Compendium of Physical Activities' own conversion, which is about as simple as exercise physiology gets:
Energy (kcal) = MET × body mass (kg) × duration (hours)Where:
- MET, the intensity value for the effort level, unitless, read from a published table. The definition underneath it is that one MET equals 1 kcal per kilogramme of body mass per hour. Sit quietly for an hour at 72 kg and you use roughly 72 kcal; ride at 8 METs for that hour and you use roughly eight times as much.
- Body mass. In kilogrammes. From pounds, divide by 2.205; from stone, multiply by 6.35.
- Duration: time actually riding, in hours. Forty-five minutes is 0.75.
The MET value is the only input you cannot read off a bike computer, so it has to be assigned from speed. The calculator here uses five bands, and prints the value it selected next to the result:
- Under 16 km/h (9.9 mph): 4.0 METs
- 16 to 19.9 km/h (9.9 to 12.4 mph): 6.8 METs
- 20 to 24.9 km/h (12.4 to 15.5 mph): 8.0 METs
- 25 to 31.9 km/h (15.5 to 19.8 mph): 10.0 METs
- 32 km/h (19.9 mph) and above: 15.8 METs
Four of those five come straight from the Compendium's bicycling rows: 6.8 METs for 10 to 11.9 mph, 8.0 for 12 to 13.9 mph at moderate effort, 10.0 for 14 to 15.9 mph, and 15.8 for racing above 20 mph without drafting. The one row the calculator does not reproduce is the 12.0 MET entry covering 16 to 19 mph. Its 10.0 band runs all the way to 32 km/h instead, so between roughly 26 and 31 km/h the tool sits below the published row and then steps straight to 15.8. Where this article quotes a Compendium value the calculator does not use, it says so.
Two features of any banded table are worth noticing before trusting anything built on it. The values arrive in steps rather than along a curve, so a small speed change inside a band moves the estimate not at all, while crossing a boundary moves it in a jump. And the bands read speed and nothing else: not wind, not gradient, not road surface.
That 3.5 deserves one more footnote most calculators skip. Measured resting oxygen uptake in adults often lands nearer 2.6 to 3.0 ml/kg/min, particularly in older, heavier and female riders. The 3.5 figure is a fixed reference point, not your personal baseline, and where it overstates your true resting rate the MET method inherits that bias.
Riders with a power meter can skip the MET tables altogether. External work is measured directly in kilojoules, then divided by gross efficiency, the fraction of metabolic energy that reaches the pedals:
Energy (kJ) = average power (W) × duration (s) ÷ 1000 ÷ gross efficiencyGross efficiency in trained cyclists sits between roughly 20% and 24%, which produces a rough shortcut worth knowing. Dividing external kilojoules by 0.22 and then by 4.184 gives a factor of 1.09, so metabolic kilocalories land within about 9% of external kilojoules. Shift the efficiency assumption to 24% and the factor falls to 1.00; drop it to 20% and it rises to 1.20. The shortcut is a coincidence of two conversion factors rather than a physical law, and it is only as good as the efficiency you assume. A cycling power calculator estimates watts from speed for riders without a meter.
A worked example
Priya weighs 72 kg (159 lb). She rides 45 minutes on flat roads at a steady 20 km/h, which converts to 12.4 mph. That speed opens the calculator's 8.0 MET band, and it is the Compendium's own value for 12 to 13.9 mph at moderate effort.
- Convert duration to hours. 45 ÷ 60 = 0.75.
- Multiply the three terms. 8.0 × 72 × 0.75 = 432 kcal.
- Round once, at the end. 432 kcal, or 1,807 kJ.
Per minute that is 9.6 kcal. Held for a full hour, the same effort gives calories burned per hour of 576 kcal (2,410 kJ). Both are gross figures.
For the net figure, run the same sum at 1 MET: 1.0 × 72 × 0.75 = 54 kcal of resting baseline. Subtracting leaves 378 kcal, or 1,582 kJ. The extra energy the ride cost above doing nothing at all for the same 45 minutes.
The gap between 432 and 378 is 54 kcal, or 12.5% of the total. That share is simply one divided by the MET value, so it shrinks as the ride gets harder: 25% in the gentlest band, 12.5% at 8.0 METs, 6.3% at 15.8. When two calculators disagree about the same ride, this is usually why: one reports gross, the other net, and neither says which.
Band selection moves the answer further than the gross and net split does. Rate that same 45 minutes at 10.0 METs and the estimate becomes 540 kcal, a jump of 108 kcal from one step up the table. On the calculator's bands Priya would need 25 km/h to get there, another 5 km/h; on the Compendium's rows the 14 mph boundary sits just 1.6 mph above her.
Her figure carries a real error band either way. Headwind, road surface, drafting in a bunch and stopping at every junction all change what the ride genuinely cost her. None of them change her average speed, and no MET table can see any of them.
How to use the cycling calorie burn calculator
The calories burned cycling calculator takes three inputs, with a metric and imperial toggle so pounds and miles per hour work as readily as kilogrammes and kilometres per hour.
- Weight in kilogrammes or pounds
- Duration in minutes, counting moving time rather than elapsed time
- Speed, which is what selects the MET band
The result is a gross figure in kilocalories, with the MET value and the speed it came from shown beneath it. That MET value is the line worth watching, because it tells you which band your speed dropped into. A rider at the top of one band and a rider at the bottom of the next get noticeably different estimates from a trivial difference in pace.
Two conversions the tool leaves to you. For kilojoules, multiply the result by 4.184. For the net figure, subtract 1 MET × body mass × hours, which is the resting baseline worked through above.
Moving time versus elapsed time is the input people get wrong most often. A three hour outing with 40 minutes of cafe stops and red lights is a 140 minute ride as far as the equation is concerned. Enter 180 and the result is overstated by nearly 29% before any other error enters the picture.
The tool takes no gradient or terrain input, so a climb, a loaded touring bike and an off road route all read as whatever their average speed says: usually a low number, for rides that cost a great deal. For those, read the Compendium row that matches and enter it directly in the custom activity MET calculator, which is what that tool is for.
Common scenarios
A daily commute
Marcus weighs 60 kg (132 lb) and rides 30 minutes each way at 17 km/h (10.6 mph). That easy pace sits in the 6.8 MET band. Each leg returns 204 kcal (854 kJ) gross, so a round trip lands at 408 kcal. Unremarkable on any single day, substantial across a working week. That is the usual shape of low intensity, high frequency riding, and because the formula is linear in time, splitting a ride into two legs changes nothing at all.
A long weekend ride
Elena weighs 90 kg (198 lb) and rides 90 minutes at 25 km/h (15.5 mph), which opens the 10.0 MET band. The estimate comes to 1,350 kcal (5,648 kJ) gross. Long sessions are where band selection turns sensitive: the Compendium's 12.0 MET row for 16 to 19 mph, which this calculator does not carry, would add 270 kcal to the same 90 minutes. The band also assumes she held that effort steadily throughout, which almost nobody does over 90 minutes.
Two riders on the same route
Two club riders finish the same flat hour at 8.0 METs. The 65 kg (143 lb) rider returns 520 kcal. The 85 kg (187 lb) rider returns 680 kcal, a difference of 160 kcal, or 31%, for identical time and identical average speed. Mass enters the equation as a straight multiplier, so at a given MET value the scaling is exactly proportional.
Riding with a power meter
A rider holding 200 W for a full hour performs 720 kJ of external work. At 22% gross efficiency the metabolic cost is 3,273 kJ, or 782 kcal. Assume 20% instead and the same ride reads 860 kcal, which shows how much rests on an assumed efficiency figure. Even so, this route skips MET bands entirely and responds to hills, wind and surges in a way average speed never will.
Comparing across sports
A cyclist cross training on foot can put both sessions on one scale by running each through its own equation. The running calorie burn breakdown works the same formula through on the running side, and the calorie burn running calculator applies running specific MET values, which makes a 45 minute ride and a 30 minute run directly comparable.
Common mistakes and misconceptions
- Treating the estimate as a measurement. Indirect calorimetry measures energy expenditure. A MET table estimates it from an average drawn from people who are not you, and a 10% to 20% spread around any published figure is ordinary. Reporting it to the nearest kilocalorie implies a precision the method has never had.
- Mixing gross and net figures. Gross includes resting energy, net strips it out. The two differ by one divided by the MET value: 12.5% at 8.0 METs, and as much as 25% in the gentlest band. Easily enough to make two perfectly correct tools look like they contradict each other.
- Mixing units without noticing. Kilojoules on a head unit are external work, not metabolic energy, and the two sit close together by arithmetic accident rather than by equivalence. Entering pounds into a field expecting kilogrammes inflates the calories burned cycling result by a factor of 2.2.
- Assuming average speed captures intensity. A rider averaging 20 km/h (12.4 mph) into a headwind over rolling terrain works far harder than one averaging the same figure on a sheltered flat road. MET bands read speed and nothing else, which is the single largest source of error for anyone riding hills.
- Reading the figure as fat loss. Energy expenditure describes what a ride cost. Appetite, later activity and total intake all sit between that cost and any change in body composition, and the equation models none of them.
Frequently asked questions
How many calories does cycling burn in 30 minutes?
For a rider of 70 kg (154 lb) holding a moderate 20 km/h (12.4 mph), the 8.0 MET band returns 280 kcal (1,172 kJ) for 30 minutes. A 55 kg (121 lb) rider pottering below 16 km/h drops into the 4.0 MET band and lands at 110 kcal, while an 85 kg (187 lb) rider racing above 32 km/h hits the 15.8 MET band and lands at 672 kcal over the same half hour. The spread is wide because three inputs move at once: body mass, speed and the band that speed selects. Entering your own figures narrows the range considerably, which is the main reason a generic per session number disappoints most people who look one up.
Does cycling burn more calories than running?
Per minute they are closer than most people expect at everyday paces. The Compendium assigns 8.3 METs to running at 8 km/h (5 mph) and 8.0 METs to cycling at 20 km/h (12.4 mph), which is near enough identical. Running pulls ahead as pace rises, reaching 9.8 METs at 9.7 km/h (6 mph), because every stride lifts and lands the whole body mass. Cycling claws the gap back through duration, since many riders sustain two or three hours where the same person would not run for one. Comparing the two fairly means comparing total session energy, not energy per minute.
Why do my bike computer and my watch give different calorie numbers?
The two devices run different models on different inputs, and neither measures energy directly. A head unit paired with a power meter measures external work in kilojoules, then divides by an assumed gross efficiency somewhere near 20% to 24%. A wrist watch has no power data, so it infers intensity from heart rate, GPS speed or accelerometer motion before applying its own regression. Differences of 10% to 20% between two devices on the same ride are ordinary, and both figures can sit comfortably inside the error band of the underlying method.
Do heavier riders burn more calories on a bike?
Body mass is a straight multiplier in the MET equation, so a heavier rider returns a larger estimate at the same MET value and duration. Riders of 65 kg (143 lb) and 85 kg (187 lb) completing an hour at 8.0 METs return 520 kcal and 680 kcal, a gap of 160 kcal. On the road the picture is more layered, because extra mass costs a great deal on climbs and matters much less on flat ground, where air resistance dominates and frontal area counts for more than weight. The equation captures the mass effect but not the terrain effect.
Sources and methodology
MET values and the kilocalorie conversion come from the Compendium of Physical Activities, which catalogues measured oxygen cost across more than a thousand activities and publishes the bicycling rows quoted here. The peer-reviewed 2024 Adult Compendium paper in the Journal of Sport and Health Science documents the most recent update, in which the majority of listed activities now carry measured rather than estimated values.
The gross and net conventions, and the relationship between oxygen uptake, MET values and energy release, follow the metabolic calculations published by the American College of Sports Medicine in its Guidelines for Exercise Testing and Prescription. Activity intensity categories follow the World Health Organization guidelines on physical activity and sedentary behaviour.
The calculator applies MET × body mass (kg) × duration (hours), assigning the MET value from speed across five bands: 4.0 below 16 km/h, 6.8 up to 20 km/h, 8.0 up to 25 km/h, 10.0 up to 32 km/h, and 15.8 above that. Figures in this article attributed to the calculator use those bands; figures attributed to the Compendium use its published rows, and every place the two part company is flagged in the text. Each number was computed at full precision and rounded once, at the end.
Putting it together
Cycling energy expenditure comes down to three inputs: rider mass, effort level and duration. Everything past that is arithmetic. A 72 kg (159 lb) rider at 20 km/h (12.4 mph) for 45 minutes lands at 432 kcal gross and 378 kcal net, and the gap between those two figures explains most of the disagreement you will ever see between tools. The 5% between the two MET definitions explains most of the rest.
The patterns underneath outlast the number. Body mass scales the total in exact proportion. Duration does the same. Speed enters only through a banded lookup, which means it moves the result in steps and ignores everything the road is doing. Gross sits above net by the resting baseline, and that share is one divided by the MET value.
The method is exact in its arithmetic and approximate in its inputs, which describes most physiological modelling reasonably well. Push a few of your own sessions through the cycling calorie estimator and you build a feel for how far each input moves the result, which is more useful in the long run than any single number it prints.
Last updated 4 August 2026.