Marathon Pacing: How to Split 42.195 km
A goal time divided by 42.195 km is one number; a pacing chart is that number laid out against every marker on the course. This guide works a 3:45:00 marathon through to 5:20 min/km (8:35 min/mile) and a full checkpoint table, shows why the unrounded pace has to survive to the last multiplication, and separates what the arithmetic settles from what it leaves to the race.
JCVerified Verified by Jobi Cheriyan, Founder & Builder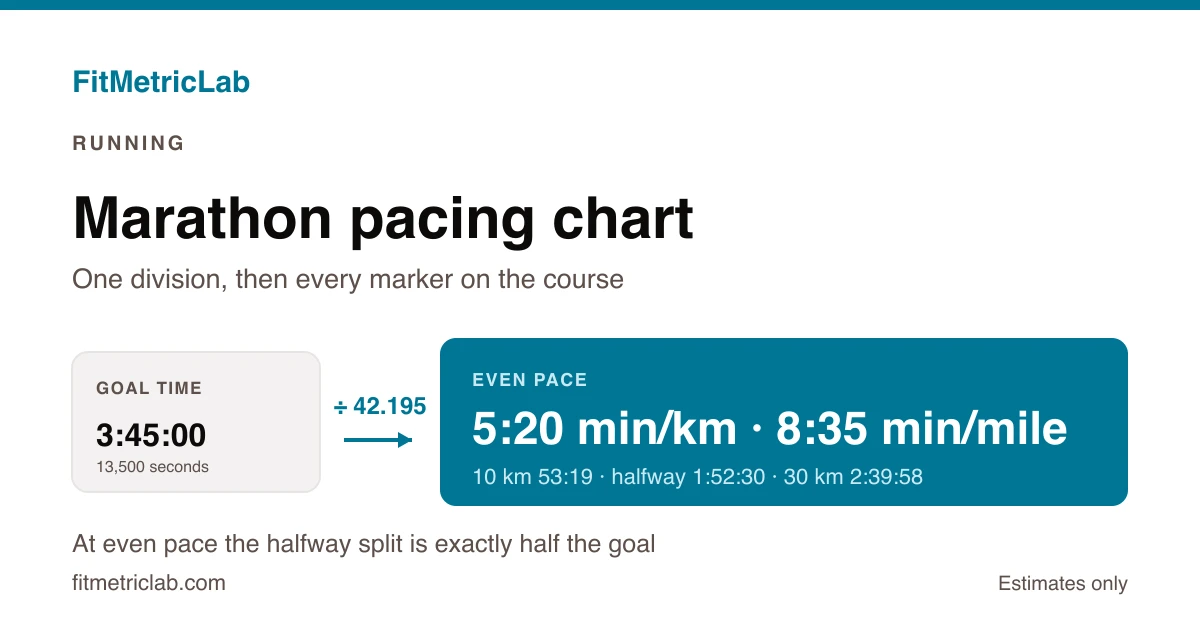
A 3:45:00 marathon is 13,500 seconds spread across 42.195 km (26.219 mi, or 26 miles 385 yards), which works out at 319.9 seconds, a pace of 5:20 min/km (8:35 min/mile), for every kilometre of it. A marathon pacing chart is the table that turns that single pace into a target time at each marker on the course, so a glance at the watch at 30 km reads as ahead or behind rather than as a bare number. The Marathon Splits Calculator builds that table from a goal time, and the arithmetic behind it is short enough to follow by hand.
What a marathon pacing chart is
A marathon pacing chart is a list of checkpoint distances with the elapsed time each one carries if the whole race is covered at one constant speed. It has two ingredients: a goal finish time, and the marathon distance, fixed by World Athletics at 42.195 km (26.219 mi). Nothing else goes in. Dividing the first by the second gives a pace, and multiplying that pace by each checkpoint distance gives the cumulative clock time at that point. Everything in the chart is arithmetic rather than physiology. It describes what constant velocity would look like on a course, and the checkpoints are wherever that course puts its markers.
Why the chart matters
The marathon is long enough that small pace errors compound. Running 10 seconds per kilometre slower than target costs 7 minutes 2 seconds over 42.195 km, and a single second per kilometre is worth 42 seconds by the finish, so a pace quoted to the nearest five seconds is a spread of several minutes at the line. A chart also makes the size of a deviation readable: thirty seconds ahead at 5 km and thirty seconds ahead at 35 km are the same number on a watch and very different fractions of what is left.
How pace is distributed across a race, not only how fast the average is, has its own research literature. Foster and colleagues reviewed pacing strategy as a determinant of performance, and Abbiss and Laursen set out the strategies athletes are observed to use, from even and positive through to negative and variable. An even-pace chart is the baseline those comparisons are drawn against, which is why it is the usual starting point rather than the only option.
How a marathon pacing chart is calculated
Three steps produce the whole table. The goal time is converted into seconds; those seconds are divided by 42.195 to give the pace in seconds per kilometre; that pace is multiplied by each checkpoint distance in turn, which gives cumulative elapsed time rather than the time for that individual segment.
Moving the chart into miles uses the mile's defined length of 1.609344 km, exact by definition rather than measured. Halfway is 21.0975 km (13.109 mi), so at even pace the halfway split is exactly half the goal time, whatever the goal is.
total_seconds = (target_hours × 3600) + (target_minutes × 60)

pace_per_km   = total_seconds / 42.195
pace_per_mile = pace_per_km × 1.609344

split_at(d)   = pace_per_km × d          # d in kilometres
halfway       = 42.195 / 2 = 21.0975 km
The variables:
- target_hours, target_minutes = the goal finish time, split into whole hours and minutes past the hour
- total_seconds = the goal time as a single number of seconds
- 42.195 = the marathon distance in kilometres (26.219 mi), a fixed constant, not an input
- pace_per_km = seconds per kilometre, usually displayed as min/km
- pace_per_mile = seconds per mile, displayed as min/mile
- d = a checkpoint distance in kilometres (× 0.621371 for miles)
- split_at(d) = elapsed time from the start line to that checkpoint, in seconds
A worked example
Take a goal of 3 hours 45 minutes.
Step 1. The goal in seconds. (3 × 3600) + (45 × 60) = 10,800 + 2,700 = 13,500 seconds.
Step 2. Pace per kilometre. 13,500 ÷ 42.195 = 319.9431 seconds per kilometre. The fraction of a second matters over 42 kilometres, so it stays in the working. Displayed, that is 5 minutes 19.94 seconds, shown as 5:20 min/km.
Step 3. Pace per mile. 319.9431 × 1.609344 = 514.8985 seconds, which is 8 minutes 34.9 seconds, shown as 8:35 min/mile.
Step 4. Each checkpoint. Multiply the unrounded pace by the distance. At 30 km, 319.9431 × 30 = 9,598.3 seconds, or 2 hours 39 minutes 58 seconds. Repeating that for the usual markers gives the chart:
Goal 3:45:00 · 5:20 min/km (8:35 min/mile)

   5 km        26:40
  10 km        53:19
  15 km      1:19:59
  20 km      1:46:39
  21.0975 km 1:52:30   (halfway)
  25 km      2:13:19
  30 km      2:39:58
  35 km      3:06:38
  40 km      3:33:18
  42.195 km  3:45:00   (finish)
Step 5. Check the ends. Halfway is exactly half the goal, as even pacing requires, and the last line returns the goal time itself. Those two checks catch most arithmetic slips. The closing 2.195 km (1.36 mi) carries 11 minutes 42 seconds of the total at this pace, so a chart that stops at 40 km is missing a substantial stretch.
How to use the Marathon Splits Calculator
The marathon splits calculator takes the goal time as two fields, hours and minutes, so a 3:45:00 target is entered as 3 and 45. There is no distance field, because the marathon distance is a constant.
The headline output is the even pace in min/km, labelled with the goal time it came from, with 5 km, 10 km and half marathon splits beneath it. Below that sits the full checkpoint table: 5, 10, 15, 20, the halfway mark, 25, 30, 35, 40 and 42.195 km. Each row is the elapsed time at that marker, not the segment alone, so subtracting one row from the row above gives the segment, which for the 5 km rows above is 26:40.
Two things the output does not do: judge whether a goal time is realistic, and adjust for hills, heat, wind or aid stations. It answers one question, which is what constant pace and constant splits the goal implies.
Common scenarios
A metric plan on a mile-marked course
Courses in the United States mark miles, most other countries mark kilometres, and races in the United Kingdom and Ireland often mark both. The same 3:45:00 chart in miles reads 8:35 at mile 1, 42:54 at 5 mi (8.05 km), 1:25:49 at 10 mi (16.09 km) and 2:51:38 at 20 mi (32.19 km), finishing at 26.219 mi. The calculator's own table is metric, so a mile column is the same pace multiplied by 1.609344 and then by each mile marker. Same race, same speed, different markers.
Planning a deliberate split difference
An even chart is a baseline, and a plan may set out to run the second half faster, one of the three patterns compared in even, negative and positive splits. At 3:45:00 with a 2 per cent gap between halves, the first 21.0975 km at 5:23.1 min/km takes 1:53:37.5 and the second at 5:16.7 min/km takes 1:51:22.5, a difference of 2 minutes 15 seconds around the same total. The negative split pace calculator produces those two paces from a total time, a distance and the gap.
Starting from a recent half marathon
A goal time has to come from somewhere before it can be charted. Riegel's formula scales a known time by the distance ratio raised to the power 1.06, so doubling the distance multiplies the time by 2.0849: a 1:45:00 half is 6,300 seconds, and 6,300 × 2.0849 = 13,135 seconds, or 3:38:55, an even pace of 5:11 min/km (8:21 min/mile). The marathon time predictor runs that calculation, and its output is an estimate from one prior performance rather than a measurement of marathon fitness. Where the exponent comes from, and where it drifts, is worked through in how to predict marathon time.
Charting a training run or a shorter race
The same three steps work at any distance once the 42.195 constant is replaced by the distance being run, and checkpoint spacing becomes a choice rather than a convention. The running splits calculator takes a distance, a time and a split length, which covers a 32 km (19.88 mi) long run marked every 2 km as readily as a 10 km race marked every kilometre.
Common mistakes and misconceptions
- Rounding the pace before multiplying. Rounding 319.9431 up to 320 seconds and multiplying by 42.195 gives 13,502.4 seconds, a finish of 3:45:02. The same effect shows up inside the table, where two rounded 5 km splits of 26:40 do not add to the 10 km figure of 53:19. Neither is an error in the chart; both are what happens when a rounded number is used as an input.
- Using 42 km or 42.2 km as the distance. The marathon is 42.195 km, and the 0.195 km left off a rounded figure is worth 62 seconds at 5:20 min/km. Dividing a 3:45:00 goal by 42 instead returns 5:21.4 min/km, a pace that arrives about a minute late.
- Mixing kilometre and mile markers. Mile 18 is 28.97 km, not 18 km, and the gap widens all the way to the line.
- Treating the chart as a prediction. An even-pace chart states what a constant speed implies. It contains no terrain, no weather, no crowding and no fatigue, and the pacing literature describes plenty of races that depart from it. It is a reference the race is measured against, not a forecast.
- Confusing pace with speed, or course distance with watch distance. Pace is time per distance and speed is distance per time: 5:20 min/km is 11.25 km/h (6.99 mph). Separately, a satellite watch records the line it tracked, which on a crowded course is longer than the certified route, so watch kilometres tend to arrive before course markers do.
Frequently asked questions
What is a marathon pacing chart?
It is a goal time broken out marker by marker. Divide the goal in seconds by 42.195 and the result is a pace; multiply that pace by 5, 10, 15 and so on and the results are the elapsed times each marker carries. Most charts run to ten rows or so, with halfway at 21.0975 km (13.109 mi) landing on exactly half the goal, and many print the mile equivalents alongside. What a chart is not is a forecast. It holds one speed from the gun to the line, which few races follow exactly, so its value is as the reference a race is read against rather than as a prediction of it.
What pace is needed for a 4 hour marathon?
Four hours is 14,400 seconds, and 14,400 ÷ 42.195 = 341.3 seconds per kilometre, which is 5:41 min/km (9:09 min/mile). The checkpoint times that follow are 28:26 at 5 km, 56:53 at 10 km, 2:00:00 at halfway, 2:50:38 at 30 km and 3:47:31 at 40 km, each one elapsed from the start rather than a segment time. The same division works for any goal: 3:30:00 gives 4:59 min/km (8:01 min/mile), 3:00:00 gives 4:16 min/km (6:52 min/mile), and 5:00:00 gives 7:07 min/km (11:27 min/mile) with halfway at 2:30:00.
Is an even split or a negative split faster over a marathon?
The research on pacing describes several patterns rather than crowning one. Abbiss and Laursen catalogue even, positive, negative, all-out, parabolic and variable pacing, and note that the strategy observed depends heavily on event duration, with longer events tending towards flatter profiles than short ones. Foster and colleagues reviewed the same question from the performance side. What the literature does not supply is a single figure that applies to an individual runner on a given course, because terrain, conditions and the runner's own history all move it. An even chart is the reference point, and a deliberate split difference is a stated departure from it.
How do I convert a marathon pacing chart from kilometres to miles?
Multiply the pace per kilometre by 1.609344 to get pace per mile, then multiply that by each mile marker. At 5:20 min/km the pace per mile is 319.9431 × 1.609344 = 514.9 seconds, or 8:35 min/mile, and mile 20 lands at 2:51:38. Converting each split time instead of the pace also works, since every split is the pace times a distance, but it invites rounding errors. The finish is 26.219 mi, usually written 26.2 mi or 26 miles 385 yards, and a chart that stops at mile 26 is 385 yards short.
Sources and methodology
Every figure above was computed from the stated inputs and checked against the calculator's output: pace is the goal time in seconds divided by 42.195, splits are that pace multiplied by the checkpoint distance, mile conversions use the exact 1.609344 km per mile, and rounding happens only at display. Two reference points sit behind the claims that are not arithmetic:
- World Athletics. Book of Rules (Competition and Technical Rules), the source of the 42.195 km marathon distance and of the course measurement rules referred to here.
- Abbiss CR, Laursen PB. Describing and understanding pacing strategies during athletic competition. Sports Medicine. 2008;38(3):239-252, the classification of pacing strategies and their relationship to event duration, alongside Foster C, Schrager M, Snyder AC, Thompson NN. Pacing strategy and athletic performance. Sports Medicine. 1994;17(2):77-85.
On wording: a split is the elapsed time at a marker in most usage and the segment time between two markers in some, so charts label which they mean. Pace runs in min/km in metric markets and in min/mile in the United States and much of the United Kingdom, kilometre is spelt kilometer and metre meter in United States English, and the printed card runners carry is a pace band in some places and a pace bracelet in others.
Putting it together
A marathon pacing chart is one division and a column of multiplications: the goal time in seconds over 42.195, then that pace across every marker on the course. The precision comes from carrying the unrounded pace through every multiplication, and the two checks that catch most errors are that halfway equals half the goal and the last line equals the goal. The marathon pacing chart for 42.195 km does that arithmetic from a goal time in one step, in kilometres. What no chart can do is put hills, heat or the closing 2.195 km into the numbers, which is the difference between a chart and a race.
Last updated 21 September 2026.